The Collector can receive telemetry data from a variety of sources, including OpenTelemetry SDKs, agents, and other collectors, and can export that data to a variety of destinations, including backend systems like Prometheus, Zipkin, and Jaeger, as well as log management systems and alerting tools. It can also be configured to perform a number of data processing tasks, including filtering, aggregating, and transforming data, as well as applying rules and policies to telemetry data.
The OpenTelemetry Collector is highly configurable and can be customized to meet the needs of different environments and use cases. It is a key component of the OpenTelemetry project, which aims to provide a consistent, standard way of instrumenting, collecting, and processing telemetry data across different languages and platforms.
Here are the 3 most popular Collector architectures and use cases that use them
The Direct Exporter architecture
A straightforward and efficient approach that uses the Collector to directly export data to your preferred monitoring platform. This architecture is ideal for users who need a simple way to gather telemetry data and quickly export it to a monitoring system without much processing. Two examples of using this architecture are:
Exporting traces directly to Jaeger, which is a popular open-source tracing system.
Exporting metrics directly to Prometheus, which is a popular open-source metrics system.
The Fan-Out architecture
A flexible and powerful approach that uses the Collector to split incoming data into different pipelines based on their source and destination. This architecture is ideal for users who need to process, transform, or enrich telemetry data before exporting it to a monitoring system. Two examples of using this architecture are:
Using the Collector to fan out traces to multiple destinations, such as Jaeger, Zipkin, and Honeycomb, each with different settings and parameters.
Using the Collector to fan out metrics to multiple destinations, such as Prometheus and New Relic, each with different aggregation and processing rules.
The Sidecar architecture
A container-based approach that uses the Collector as a sidecar process to collect and export telemetry data from a containerized application. This architecture is ideal for users who need to collect telemetry data from multiple containers running on a single host. Two examples of using this architecture are:
Using the Collector as a sidecar process to collect and export traces from a microservices-based application running in Kubernetes.
Using the Collector as a sidecar process to collect and export metrics from a containerized application running in Docker.
In summary, the OpenTelemetry Collector is a versatile tool that provides different architectures to collect, process, and export telemetry data to different monitoring platforms. By selecting the appropriate architecture for your use case, you can customize your observability pipeline to meet your specific needs.
For more information and free consultation meeting –Sign Up Here.
Top five observability pricing traps
Unbudgeted monthly overage fees and penalties
Subscription-based billing for enterprise software is designed to maximize committed shelfware (software that was paid for but not used). While using too little of your commit results in shelfware, using too much usually results in overage penalties. This is beneficial for vendors but not for you.
Many observability vendors include limited amounts of data ingestion, data retention, containers, custom metrics, synthetic checks, and so on as part of their bundled per-agent or lower-priced edition limits. To avoid surprise costs, it’s important to consider these limits and the costs of exceeding them when forecasting your budget.
For example, charging per container imposes a configuration burden on your engineering teams since some observability vendors (like Datadog) charge a premium for monitoring more than five containers running continuously on an infrastructure host, which is extremely common (most customers run 20 or more). And Splunk charges a 150% overage fee if you exceed your monthly subscription usage level for synthetic checks.
Cheap introductory pricing with unpredictable costs as you scale is frustrating. Beware of “starting at” pricing. For example, Datadog offers a lower price if you have an annual contract, including a monthly spending commitment, and a 17–50% higher on-demand price if you don’t have an annual contract or exceed your monthly commitment. Its on-demand price for hosts is 17–20% higher and logs are up to 50% higher!
In addition, for any pricing unit, you should be able to burst (autoscale without penalty) during seasonal spikes or unpredictable workload increases.
Tools to query, track, and alert on billing-related usage are a best practice because they make accurate sizing and pricing easier. For example, you should be able to create an alert when data usage exceeds a fixed monthly threshold for gigabytes. Unfortunately, not all observability vendors provide these tools, so ask whether they do and, if so, how. However, you shouldn’t have to establish daily quotas that you anticipate you’ll run over during peak and seasonal periods, which would result in constantly adjusting quotas.
With usage-based pricing and billing, you don’t have to predict upfront how much data you’ll use over the next year(s) or deal with shelfware if you use too little or penalties if you use too much. Choosing a usage-based pricing and billing vendor helps you avoid unbudgeted overages after spending tons of time attempting to forecast the annual spend for each SKU.
Paying for the whole month or year at your peak usage level
Another variable to consider is how the vendor handles seasonality, blue/green deployments (also known as canary deployments), and traffic spikes. Some observability vendors (like Datadog, Elastic, and Splunk) price by high watermark (peak) usage instead of for your actual usage. In a world where infrastructure scales up and down with customer demand, charging at a peak rate is predatory, as spikes can double your bill. For example, during a winter holiday season, you may have higher usage due to greater user traffic on your frontend applications, which essentially penalizes you for success. Ideally, you should only pay for what you use instead of paying for peak usage all month.
Paying for unwanted bundles to get the capabilities you need
For observability vendors that use a bundle-of-SKUs approach, consider whether that vendor forces you to bundle adjacent use cases. This could mean that if you want just application performance monitoring (APM), you must also sign up for infrastructure monitoring. For example, Datadog requires you to have infrastructure monitoring for every billable APM host, which would increase your APM costs by the cost of the monitoring infrastructure as well.
Constant re-forecasting and re-contracting for 16+ different SKUs
All major observability vendors (except New Relic) use a bundle-of-SKUs approach with up to 20 different infrastructure- and service-based pricing units (such as hosts, agents, nodes, CPU cores, and so on), which are not stable, often as committed use-it-or-lose-it monthly amounts. This complex bundle-of-SKUs approach requires you to forecast your usage based on your historical usage, which can be challenging, especially if you’re experiencing rapid growth.
This complicated forecasting process can be further frustrating when hit by surprise overages. When your monthly usage exceeds your commitment, you’ll receive an unbudgeted bill for overage fees and on-demand penalties. Just a few hours of higher traffic could double your monthly costs!
Developers constantly evolve their applications to take advantage of new technologies, shifting from on-prem to cloud, large to small virtual machines (VMs), VMs to Kubernetes (K8s), K8s to serverless containers, containers to serverless functions, and so on. As your applications and components change with each sprint, you must re-analyze, re-forecast, and re-contract each month for each SKU. This is a difficult task and inefficient use of time for most teams, so many customers are repeatedly hit with unbudgeted overage bills and constantly have to re-negotiate ever-larger contracts with these vendors. Instead, look for a pricing model that’s weighted based on stable pricing units like users.
Whereas New Relic all-in-one pricing gives you the flexibility to use any of our 30+ capabilities as your needs change, enabling full-stack observability with no cost penalties or complicated forecasting.
Data explosion doubling your bill
Data is the biggest variable cost for observability. As you shift from on-prem to cloud and microservices, there can be hundreds of small programs instead of a few large programs. Customers generally report 2–10x telemetry data increases or more. And data can double every two to three years—a data explosion. The associated network, storage, and compute costs can add up quickly.
A common challenge is that log volumes are unpredictable when it comes to forecasting costs. For example, system and user load along with unexpected code changes can cause Datadog log management costs to explode. Datadog has a complicated formula to calculate how logs are used that can add more than US$2.50–$3.75 per one million logging events for 30 days of retention. With an average of 1.5–2 GB per million events, that would be US$1.00–$2.50 per GB! That’s a lot more than the advertised data ingest rate of US$0.10/GB. Splunk charges approximately US$4.00 per GB for logs. Elastic charges per server in your Elasticsearch cluster and an increase of data loggings requires an increase in Elasticsearch servers. So, doubling your data ingestion can double your cluster size and costs.
Therefore, it’s important to future-proof cloud adoption by looking for an observability vendor that offers a low data cost per GB.
And, to reduce the amount of data ingested (and data ingest bills), you should be able to manage your data ingest by configuring data-dropping rules that filter out unimportant, low-value data and potentially sensitive data.
Alicia Basteri has 20+ years of content and marketing experience, mostly for software companies. Prior to New Relic, she worked for Synopsys, 3D Systems, Microsoft, and others writing about varied topics, including licensing, pricing, cyber security, compliance, electronic medical records, 3D printing, and, of course, observability. She currently specializes in long-form content like reports, white papers, and eBooks—plus the occasional blog post.
The How and Why of Using Terraform With PagerDuty
For starters, it’s fast. When your infrastructure is all defined as code you can run a script to deploy a series of virtual servers; launch things like containers, databases, and load balancers; and configure any cloud service you might need—such as PagerDuty. Writing the configuration in code also helps keep the settings consistent, reduce the chance of introducing errors, and mitigate deviations between deployments.
Think of the last time a single engineer in your organization was the largest source of knowledge about a certain part of your deployment process. And now, think of how frustrating it was when that engineer left with that knowledge and the rest of the team had to scramble to figure out the missing pieces. When your infrastructure is defined as code, it is already documented for the whole team to see. Engineers can look at the code in a single place and read how the services and processes are configured. This minimizes the risk of losing valuable system knowledge. Of course, the configurations could be documented in a wiki. But we all know that trying to find the right information in a wiki can be a lot of extra work.
All of these benefits of configuring infrastructure as code point to the main reason for this strategy and that is increased efficiency. Knowing that the infrastructure is configured as expected gives engineers the confidence that it can be automatically deployed without any trouble. Then, the engineers can focus on building rather than configuring.
Tools such as Terraform from HashiCorp have emerged as one of the leading ways to declaratively configure technology stacks. And, PagerDuty is among the most popular services that is being being configured by Terraform users. PagerDuty is one of the top 20 Terraform providers, and in this post, I’ll describe how you can use it to configure your PagerDuty account.
Terraform
Terraform is an open-source software tool from HashiCorp that allows you to build, change, and version your infrastructure through code. It allows you to configure your infrastructure and services using a declarative programming language called HashiCorp Configuration Language (HCL).
As organizations adopted more external services, Terraform has grown with the trends to also support configuring a variety of applications. Today, Terraform is a configuration engine that interacts with over 200 providers to manage most of the pieces of your infrastructure. There are providers for everything from AWS to MySQL to Datadog.
The general idea of using Terraform with PagerDuty is to use it as the one source for creating, editing, and deleting resources in your PagerDuty account. With teams using Terraform as their tool of choice for defining other pieces of their infrastructure, it’s only natural that they would also want to configure their PagerDuty accounts in order to keep all of their infrastructure defined in a single location.
Terraform allows teams to manage their infrastructure in a safe, readable, and easily repeatable way. While the HCL code used in Terraform was developed by HashiCorp, engineers will recognize that it looks a lot like JSON. For example, to create a team in PagerDuty, the Terraform configuration would look something like this:
resource "pagerduty_team""eng_seattle"{
name =“Engineering(Seattle)"
description = "All engineers inSeattle office"
}
Then, to add team members to that team, a user and team membership resources would be created:
Once all the configuration is set, the Terraform code can then be checked into a version control system so that a history of changes can be recorded in case there needs to be a roll-back in the deployed definitions.
Each time that Terraform runs it defines the state of your service settings. In the case of PagerDuty, if resource definitions for things such as users or teams are removed from the files, Terraform will think that you want to delete them in PagerDuty. So, be sure to have a clear understanding across the organization that Terraform is the source of truth for PagerDuty settings, and not the PagerDuty web interface.
Before we get too much further into showing code, it’s important to point out that there are three Terraform products from HashiCorp–Open Source, Cloud, and Enterprise. To get started with and experiment with Terraform this article will use the open source product as the example. Check out the Installing Terraform article from HashiCorp if you’re brand new to the product.
PagerDuty Terraform Provider
PagerDuty’s Terraform provider began as a community success story. The project was started by Alexander Hellbom, a DevOps Engineer in Sweden. Alexander’s company defined nearly all of its infrastructure configurations in Terraform. When they adopted PagerDuty, Alexander discovered that there wasn’t a PagerDuty provider and set out building one on his own. The reception he received from the Terraform community was so positive and supportive that he has continued to maintain the project to this day. Alexander continues to be involved as a maintainer, but PagerDuty has begun to take a more active role.
The PagerDuty provider supports a wide array of PagerDuty resources, from Add ons and Escalation Policies to Maintenance Windows and Schedules. Head over the the PagerDuty Provider documentation to see a full list of resources that are supported.
Example
Before creating any Terraform files you’ll first need to generate a REST API Key in PagerDuty. The key that you generate will be used as the value for token below.
To get started defining PagerDuty settings with Terraform, create a directory where you want to store your Terraform (.tf) files. In that directory create a new file with the .tf extension. For learning purposes, you can create a provider block for ‘pagerduty’. That block initializes the PagerDuty provider, setting the value of token using the API key generated above, and will look something like this:
Now, in production, you may be a little squeamish about checking API keys into code repositories, and rightfully so. The provider also supports reading the access token from your environment variables. To do this, set an environment variable named PAGERDUTY_TOKEN with the value of your API key. When the PagerDuty Terraform Provider finds this environment variable it will initialize the PagerDuty provider using that variable, and you no longer need to use a provider block in your code.
With the provider set, you’ll now use resource blocks to define the specific PagerDuty objects you want to create and manage. Building off of the example above, where we defined Susan Developer as a user and added her to the “Engineering (Seattle)” team, we could now create an Escalation Policy that included her team with the code below.
To reference the values defined for Susan’s user and team you provide an expression that takes the type of the resource, the name you gave it, and then the field you want to reference. For example, to get the team ID for the eng_seattle team you would write pagerduty_team.eng_seattle.id. Using that syntax, we can now define the escalate_seattle_eng Escalation Policy for Susan’s team (referenced as pagerduty_team.eng_seattle) and using Susan as a target (referenced as pagerduty_user.susan_developer).
resource "pagerduty_escalation_policy""escalate_seattle_eng"{
name ="Seattle Engineering Escalation Policy"
num_loops =2
teams =[pagerduty_team.eng_seattle.id]
rule {
escalation_delay_in_minutes =10
target {
type ="user"
id = pagerduty_user.susan_developer.id
}}}
Terraform Plan and Apply
Before running any other Terraform commands, you’ll need to initialize Terraform by running terraform init. This will check the Terraform files in your current directory and install any providers that are referenced. In this case it will install the latest version of provider.pagerduty. With Terraform initialized, it’s time to test out our definitions.
With Terraform initialized, it’s time to verify the definitions that you made. To do this, run terraform plan. This creates an execution plan that determines which actions need to be taken to get to the state defined in your configuration files. This is a really nice way to make sure that the changes you defined actually create the desired outcome, and prevents you from making any unwanted changes.
When you are satisfied with the state described in the execution plan, it’s time to run terraform apply to actually execute those changes. Terraform will show you the output of the plan again, and then ask for you to type the word ‘yes’ to confirm that you want the planned changes to occur. After you confirm, and the plan is executed, Terraform will provide a message communicating the result of each change that was carried out.
In addition to tackling the technical complexity of provisioning systems, HashiCorp also recommends some practices for addressing the organizational complexity of maintaining infrastructure as your operation scales. Similar to how when an application grows it is broken up into microservices that are each focused on a specific thing, they’re built and managed by a single team, and can usually be developed in parallel with other services—as long as their API doesn’t change. In a similar way, Terraform configurations can be broken up into smaller configurations and delegated out to different teams. Each configuration uses something called output variables to publish information and remote state resources to access output from other configurations.
Closing
For more information on what the PagerDuty Terraform Provider has to offer, checkout the PagerDuty Provider documentation on HashiCorp’s Terraform site. To ask questions, post issues, or submit contributions to the PagerDuty Provider project, head over to the Terraform Provider PagerDuty repository on GitHub. Also, to learn more about Terraform, have a listen to the “Talking Terraform with HashiCorp” episode of the Page It to the Limit podcast where we sat down with Paul Hinze, Senior Director of Engineering for Terraform, and Robbie Th’ng, Director of Product for Terraform.
If you don’t already have a PagerDuty account, sign up for a free Guided Trial today.
Get to the Root (Cause Analysis) in 5 Easy Steps
In the PagerDuty platform, Root Cause Analysis* refers to a set of features that aims to provide you, the responder, with as much context and actionable intelligence as possible. By surfacing past and related incidents, as well as insights into incident frequency, responders will have tools to quickly gain the situational awareness they need to determine probable root cause and speed up triage, and ultimately resolve faster. Likely origin points based on historical data will also be highlighted to help add context.
Here are the five places on the incident details page to help you investigate the potential root causes:
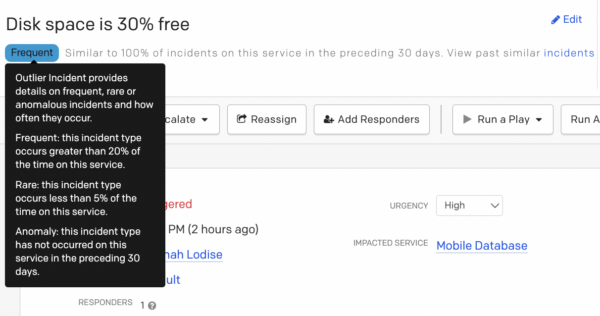
Outlier Incident
When first opening an incident, look for the Outlier Incident classification label. This label is located directly under the incident name and will have a classification label of “Frequent,” “Rare,” or “Anomaly.” Based on this classification label, you can quickly gauge whether this incident has occurred before and how you might respond to it based on past experiences. Hover over the label to read their definitions.
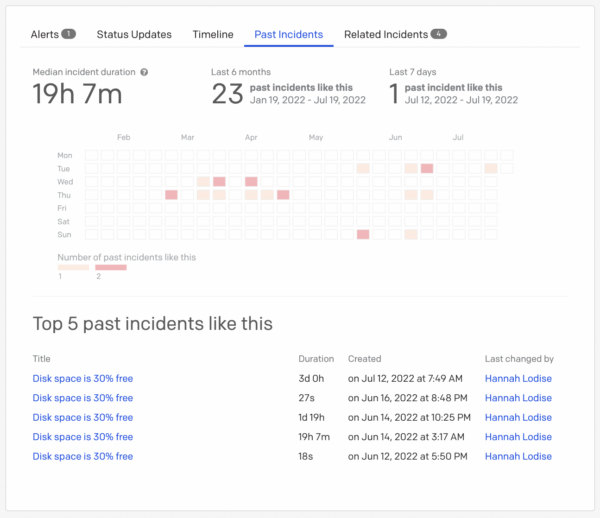
Past Incidents
Once you have determined the frequency at which the incident has occurred on the service, navigate to the Past Incidents tab further down the page. A heat map is displayed to show when previous incidents like this open incident have occurred over the last six months. Look for patterns in the colors – darker colors equal higher concentration of incidents – or hover over the heatmap colors to see further details about the relevant incidents. Below that are details about the Top 5 past incidents like the open incident (if there are any!) along with information about when they occurred and who last changed the incident. Note: That person would be a great resource if you want to ask them about what they did/see their notes on the incident! To open up the incident details page for any past incident, click on the hyperlinked title.
Related Incidents
Another quick source of information is the Related Incidents tab. Here you see if there are currently any ongoing incidents that might be related to your issue from across all services, unlike Past Incidents, which only shows similar incidents on the same service. Understanding the scope of an incident across the business (is this isolated or part of a larger problem?) can help you understand the impact and to quickly identify who you need to collaborate with to fix the problem.
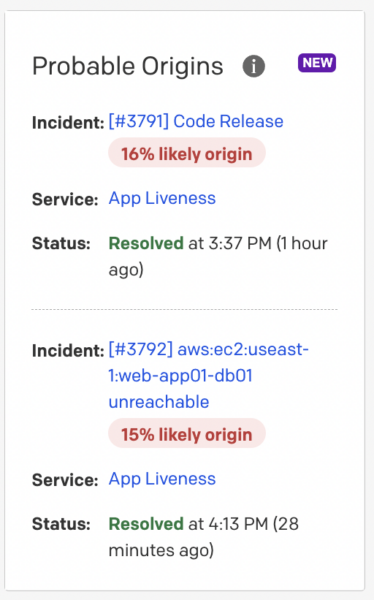
Probable Origins
Jump start your triaging efforts with the Probable Origins widget located on the incident details page. This widget will calculate the likely origin percentage based on historical data, like whether the incident occurred directly before or after a similar event to the current open incident.
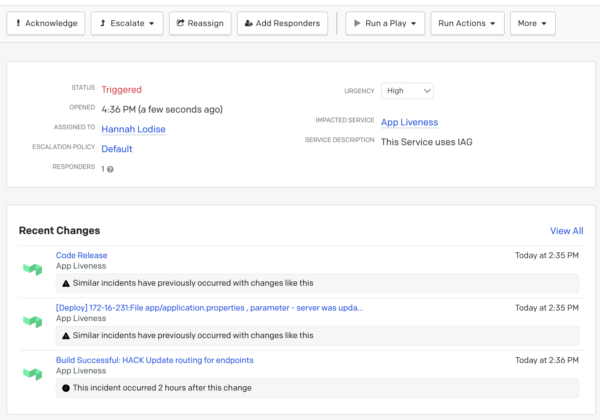
Change Correlation
Lastly, it can greatly accelerate resolution when you are aware of any changes to your infrastructure or code that might have caused the incident. Change Correlation, displayed under Recent Changes on the incident detail page, shows the three recent change events that are most relevant to an incident based on time, related services, or PagerDuty’s machine learning. The recent change events will indicate why the platform surfaced the event, helping you to easily narrow down potential causes.
Knowledge check! True or false: The Past Incidents tab displays Resolved Incidents from the same service, while Related Incidents will display only Open Incidents on other services. (see answer at the bottom of the page)
How’d you do? Remember, these are five places you can look, to quickly gain context and jumpstart your triaging efforts.
To solve incidents faster and help reduce downtime further, combine this set of Root Cause Analysis features with Noise Reduction and Event Orchestration capabilities. If you need a refresher, take PagerDuty University’s Event Intelligence courses and then show off your ability to work smarter, not harder, by completing the Event Intelligence Certification!
Resources for Next Steps:
Event Intelligence Courses can be found on the PagerDuty University eLearning Portal.
Noise Reduction
Event Orchestration
Root Cause Analysis
Event Intelligence Certification Exam information can be found on this page under “Specialty Product Certification.” As a celebration of this new series launching, we are offering complimentary registration for the exam for 30 days, so register now!
*Footnote: While we refer to this category of features as Root Cause Analysis, PagerDuty is not predicting or identifying root cause. Rather, our features help to create context around incidents to drive faster resolution. It’s also worth noting that there has been an industry shift to adopt the term probable or proximate cause rather than suggesting that there is any one true “root cause.”
Knowledge Check Answer: False. While the statement is correct that Past Incidents only displays resolved incidents from the past that were on the same service, Related Incidents will look at other active incidents – open and recently resolved – across ALL services (including the service your current incident is on) to find if any incidents are related to your current incident.
If you don’t already have a PagerDuty account, sign up for a free Guided Trial today.
Toil: Still Plaguing Engineering Teams
Why Toil Matters
Unfortunately, “not enough time and too much to do” describes the default working conditions inside operations orgs. There is an unlimited supply of planned and unplanned work — new things to roll out, incidents to respond to, support requests to answer, technical debt to pay down, and the list goes on.
With only so many hours in the day, how do you make sure what you’re working on actually makes a difference?
How do you make sure your team and your broader organization maximize the kinds of work that add value and find ways to eliminate work that doesn’t? After all, organization and team decisions dictate the majority of your work.
To maximize both the value of your engineering organization and the human potential of your colleagues, you need an objective framework to identify and contain the “wrong” kind of work and maximize the “right” kind of work. Understanding what toil is — and keeping the amount of toil contained — provides economic benefits to your company and improves the work lives of fellow engineers.
What is the Definition of Toil?
Google first popularized the term “toil,” and the SRE movement, and it has since been pushed to IT operations.
In a nutshell, SRE is about injecting software engineering practices — and a new mindset — into IT operations to create highly reliable and highly scalable systems. Interest in the topic of SRE has skyrocketed since Google published their Site Reliability Engineering book.
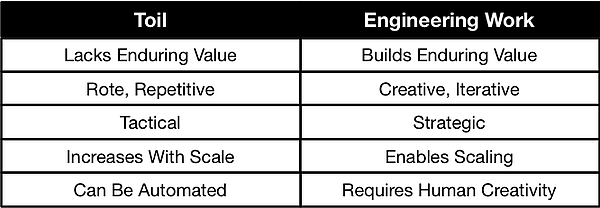
In the book, Vivek Rau articulates an excellent definition, “Toil is the kind of work tied to running a production service that tends to be manual, repetitive, automatable, tactical, devoid of enduring value, and that scales linearly as a service grows.”
The more of these attributes a task has, the more confidence you can have in classifying the work as “toil.” However, just because work is classified as toil doesn’t mean that a task is frivolous or unnecessary. On the contrary, most organizations would grind to a halt if the toil didn’t get done.
A goal of “no toil” sounds nice in theory. However, in reality, a “no toil” goal is not attainable in a business. Technology organizations are always in flux, and new developments (expected or unexpected) will almost always cause toil. Just because a task is necessary to deliver value to a customer doesn’t mean that it is always value-adding work. Toil may be necessary at times, but it doesn’t add enduring value (i.e., a change in the perception of value by customers). Long-term, we should want to eliminate the need for the toil.
The best we can hope for is to be effective at reducing toil and keeping toil at a manageable level across the organization. Toil will come from sources you already know about but just haven’t had the time or budget to automate (e.g., semi-manual deployments, schema updates/rollbacks, changing storage quotas, network changes, user adds, adding capacity, DNS changes, service failover). Toil will also come from any number of unforeseen conditions that can cause incidents requiring manual intervention (e.g., restarts, diagnostics, performance checks, changing config settings).
What Should People Be Doing Instead of Toil?
Instead of engineers spending time on non-value-adding toil, you want them spending as much of their time as possible on value-adding engineering work.
Also pulling from Vivek Rau’s helpful definitions, engineering work can be defined as the creative and innovative work that requires human judgment, has enduring value, and can be leveraged by others.
Working in an organization with a high ratio of engineering work to toil feels like everyone is swimming towards a goal. Working in an organization with a low ratio of engineering work to toil feels more like you are treading water, at best, or sinking, at worst.
High Levels of Toil Are Toxic
Toil may seem innocuous in small amounts. However, when left unchecked, toil can quickly accumulate to levels that are toxic to both the individual and the organization.
For the individual, high-levels of toil lead to:
Discontent and a lack of feeling of accomplishment
Burnout
More errors, leading to time-consuming rework to fix
No time to learn new skills
Career stagnation (hurt by a lack of opportunity to deliver value-adding projects)
For the organization, high-levels of toil lead to:
Shortages of team capacity
Excessive operational support costs
Inability to make progress on strategic initiatives (the “everybody is busy, but nothing is getting done” syndrome)
Inability to retain top talent (and acquire top talent once word gets out about how the organization functions)
One of the most dangerous aspects of toil is that it requires engineering work to eliminate it.
Reducing toil requires engineering time to either build supporting automation to automate away the need for manual intervention or enhance the system to alleviate the need for the intervention in the first place.
Engineering work needed to reduce toil will typically be a choice of creating external automation (i.e., scripts and automation tools outside of the service), creating internal automation (i.e., automation delivered as part of the service), or enhancing the service to not require maintenance intervention.
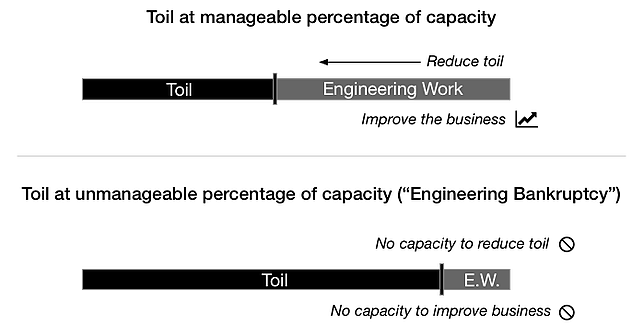
Toil eats up the time needed to do the engineering work that will prevent future toil. If you aren’t careful, the level of toil in an organization can increase to a point where the organization won’t have the capacity needed to stop it. If we use the Technical Debt metaphor, this would be “engineering bankruptcy.”
The SRE model of working — and all of the benefits that come with it — depends on teams having ample capacity for engineering work. This capacity requirement is why toil is such a central concept for SRE. If toil eats up the capacity to do engineering work, the SRE model doesn’t work. An SRE perpetually buried under toil isn’t an SRE, he is just a traditional long-suffering sysadmin with a new title.
Why PagerDuty Cares About Toil
One of our main goals is to improve the work-lives of operations professionals. Reducing toil and maximizing engineering time does just that.
Our users have often shown us how they use PagerDuty Process Automation and Rundeck in their efforts to reduce toil.
Benefits include:
Reduction in variation and errors to reduce toil by standardizing procedures.
Making it easier to do engineering work that reduces toil by automating tasks that previously required a lot of toil.
Stop one team from creating toil for another team by enabling self-service and allowing others to do operations tasks themselves.
If you don’t already have a PagerDuty account, sign up for a free Guided Trial today.
Introducing “Automated Diagnostics”
Introducing “Automated Diagnostics”
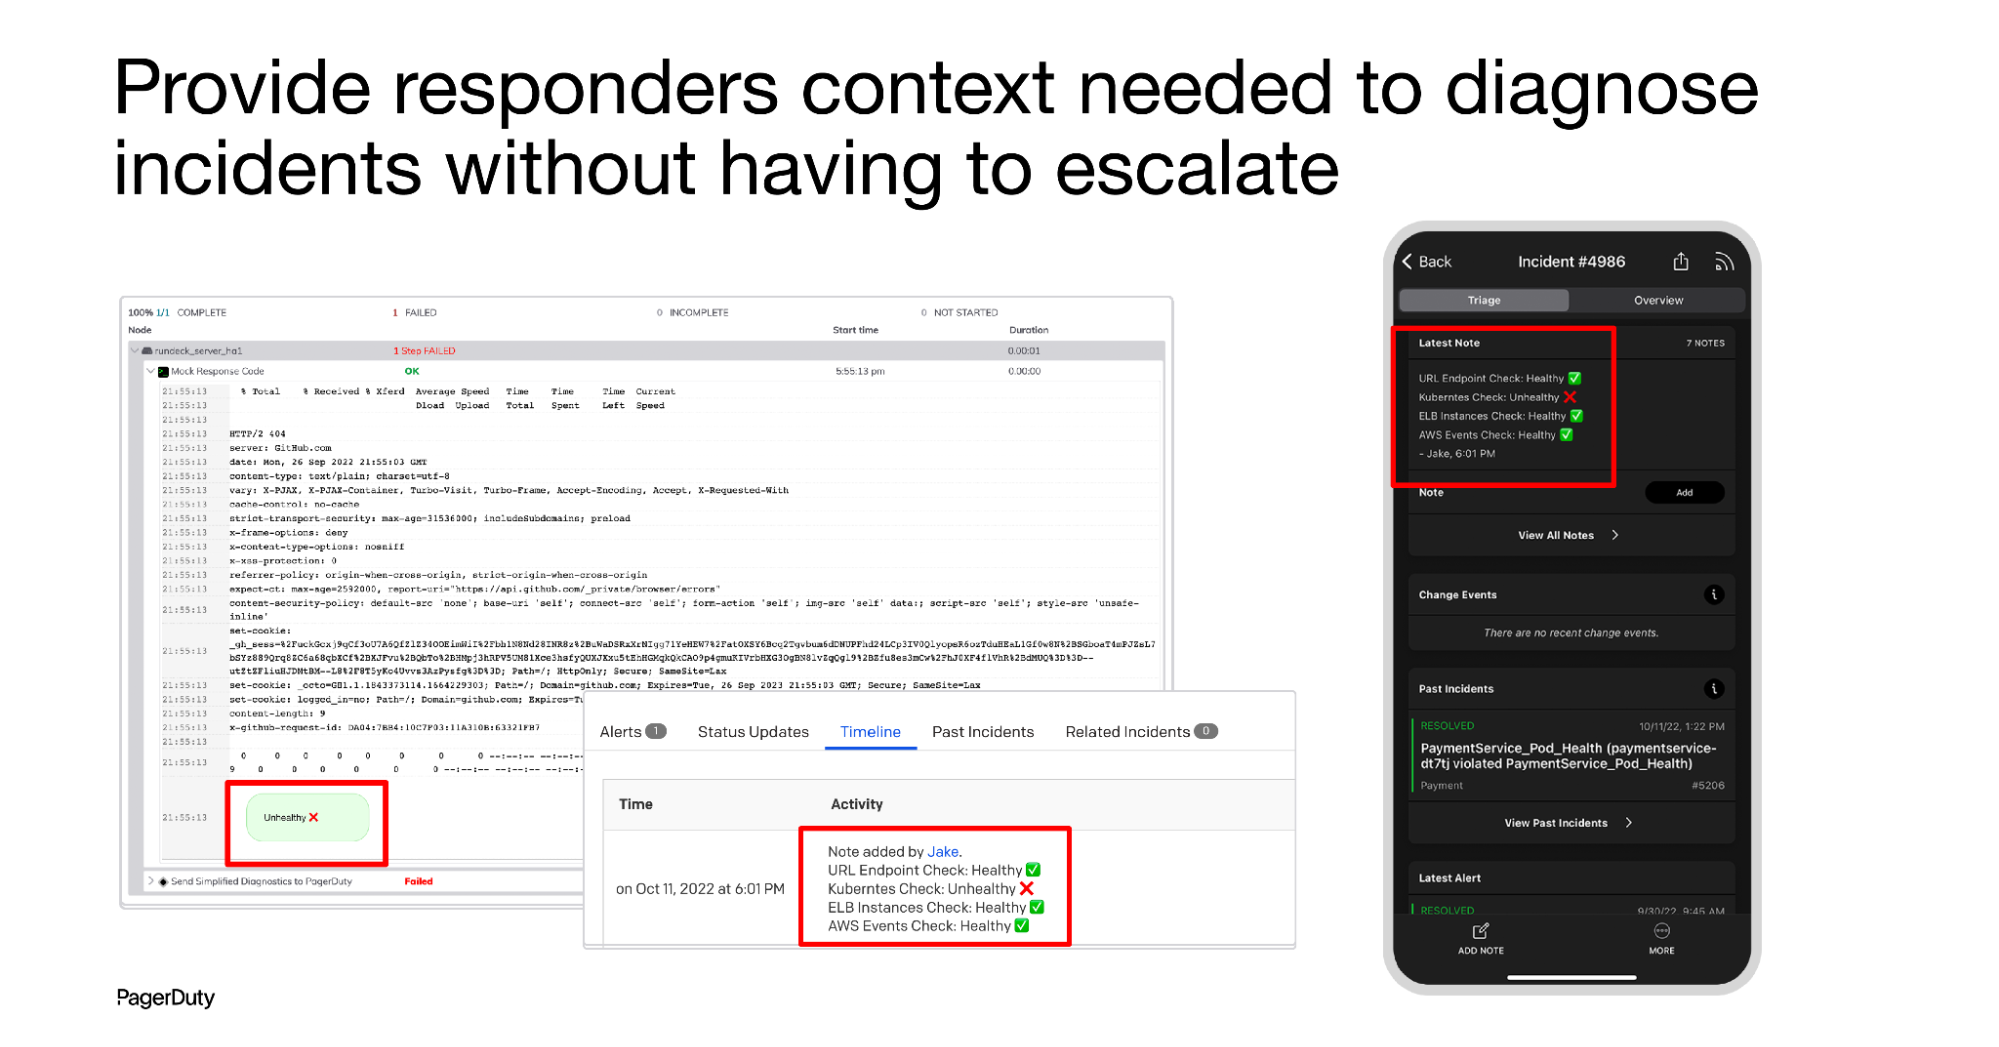
The challenge for many companies is that the deeper data needed to make accurate diagnoses is locked away in production environments, and requires specialists to extract because of their knowledge, skills, and access privileges.
To answer the questions of “What went wrong?” and “Who can fix it?” a first responder has to summon on average at least 3 other engineers to pull information to which only they have proper access.
The bottom line is too much time and too many people hours are spent repeatedly gathering diagnostic data. Automating this repetition will speed up MTTR by at least 15 minutes and reduce costs and interruptions by at least 50%.
According to Gartner, “by 2023, 40% of all enterprise workloads will be deployed in cloud infrastructure and platform services, which is an increase from 20% in 2020.” This quote further drives home the reality that cloud adoption continues to be a top priority for enterprises looking to further digitize their services and backend infrastructure.
Cloud services give you unprecedented scale, agility, and speed of innovation, but teams face increasing complexity and ever-growing dependencies across systems, processes, and their organizations. This complex situation threatens to put the customer and employee experience — not to mention revenue — at risk.
As organizations migrate to the cloud and deploy cloud-native architectures, the increased complexity can cause more (expensive) incidents. Many organizations run in complex cloud architectures containing several interconnected services — many existing ephemerally — that are deployed across different availability zones and accounts. When incidents happen, it can take a long time to resolve them without understanding the root cause or who has the proper access privileges and subject matter expertise. This means lots of escalations and developers being pulled away from high-value work.
Incidents can get expensive — really expensive. A major retailer can lose upwards of $200K per minute in revenue every minute the site is down. Incidents also incur productivity costs, as engineers are working on fixing the problem instead of building new features and focusing on innovation. A poor customer experience because of or during an incident can further cost an organization dollars in the form of brand reputation. And when you add up all of those factors, the cost of an incident is much higher than you may have accounted for.
Resiliency matters
Resiliency is essential to ensuring that your customers enjoy their digital experiences with little to no interruption. The uncomfortable reality? Things will inevitably break and services will go down. It happens to all of us. What really matters is how fast you can recover and get your services back in the green, in addition to ensuring similar incidents like that don’t occur again in the future. Ensuring you have full visibility across your hybrid infrastructure and making sure you can detect and diagnose issues quickly is essential to continuity of your business and all your services.
Resilience doesn’t just happen, it’s a shared responsibility. Customers have to set up their infrastructure, operations, and people in a way that helps them endure and quickly respond to incidents. Defining clear ownership and accountability by having teams build and own their services is an essential part ensuring that you can have focused, real-time incident response.
PagerDuty empowers teams with end-to-end incident response and advanced automation capabilities that quickly and accurately orchestrate the right response, every time. Process Automation helps teams to quickly diagnose and resolve incidents by significantly reducing the number of escalations and MTTR so engineering teams can focus on continuous improvement and innovation.
Too many humans, too little time
Modern cloud architectures for AWS customers are composites of some 250 AWS services and 25,000 SaaS workflows available in the market, combined with in-house developed software and other legacy systems.
When incidents occur in these complex cloud environments, access to full cloud stack expertise is often needed to determine probable root cause, rule out other possibilities among dependencies, and check for false positives. This may require a first responder to escalate to several expert engineers to gather these diagnostics to determine who the ultimate resolver should be.
First line responders often lack know-how and access to gather diagnostic content in AWS environments. Many first line responders are generalists, and lack technical knowledge of what investigations are needed to diagnose specific issues in services. First responders also lack superuser access to be able to execute technical investigations due to security policies.
This means first responders typically must escalate to multiple experts to get the data they need to triage an incident, consuming more staff time to resolve the incident and interrupting more team members. For serious outages this needlessly extends the length of time it takes to resolve an incident, takes engineers away from high-value work, and increases the overall cost of an outage. Automation can play a key role in not only resolving incidents faster, but in arming first responders with the diagnostic data they need to resolve incidents on their own, thus safeguarding valuable engineering time.
Automated Diagnostics for AWS
With Automated Diagnostics for AWS, incident responders can quickly triage incidents themselves, reducing the need to escalate for help, speeding up resolution for customers, and increasing operational efficiency. Automated Diagnostics for AWS in PagerDuty provides frequently used, pre-built diagnostics job templates for commonly used services, including Amazon EC2, AWS Lambda, Amazon ECS, Amazon RDS, and more. Customers can easily configure these template jobs to work in their specific environments and extend the diagnostics steps in a workflow. Automated Diagnostics for AWS also allows customers to quickly design their own diagnostic jobs for AWS, and corrective automation for mitigation and remediation that can be invoked by responders within PagerDuty Incident Response, or triggered by PagerDuty Event Intelligence.
Customer Service teams and stakeholders are coordinated with real-time status information to deliver a better customer support experience. Automation helps internal teams operate more efficiently by shaving 25 minutes off MTTR, reducing the number of people required to resolve an incident and decreasing the number of escalations by 40%, saving time and money while improving the customer experience.
Automated Diagnostics for AWS:
Empowers first responders with the power to triage, mitigate, and resolve incidents, improving MTTR across the board.
Reduces escalations to engineers by using pre-built job templates and plugin integrations to critical AWS tools and services
Enables teams to continuously improve the efficiency of incident response within their AWS environments giving time back to engineers
If you don’t already have a PagerDuty account, sign up for a free Guided Trial today
Webiscope is now part of Aman Group
We are happy to announce that Webiscope is now part of Aman Group. We look forward giving our customers and partners greater value with more complete solutions and outstanding service.
This website uses cookies so that we can provide you with the best user experience possible. Cookie information is stored in your browser and performs functions such as recognising you when you return to our website and helping our team to understand which sections of the website you find most interesting and useful.
Strictly Necessary Cookies
Strictly Necessary Cookie should be enabled at all times so that we can save your preferences for cookie settings.
If you disable this cookie, we will not be able to save your preferences. This means that every time you visit this website you will need to enable or disable cookies again.

 Here are the 3 most popular Collector architectures and use cases that use them