Unlocking Efficiency and Prosperity: The Transformative Power of AIOps in DevOps
The genesis of AIOps—short for Artificial Intelligence for IT Operations—lies in its ability to intelligently automate, optimize, and transform IT operational tasks by assimilating vast torrents of data across various IT domains. At its core, AIOps employs machine learning (ML), data analytics, and various strands of AI such as natural language processing (NLP) to dissect and digest the big data gleaned from IT infrastructure, applications, and monitoring tools.
From its inception, AIOps was envisioned as a lever to elevate DevOps—a set of practices aimed at unifying software development (Dev) and IT operations (Ops)—from its reliance on manual interventions and a reactive posture. DevOps, as an ethos, prioritizes speed, agility, and collaboration in the delivery of IT services. When DevOps converges with AIOps, the resultant synergy enables teams to transcend conventional limitations and foster a proactive, self-regulating IT environment. The influence of AI on DevOps extends from predictive analytics to incident response, encompassing dynamic orchestration of resources and sophisticated pattern recognition that empowers teams to preempt issues rather than scramble post-outbreak.
Consider, for instance, a visual analogy where AI represents an intelligent conductor orchestrating a vast array of instruments that is the IT ecosystem. This ‘conductor’—through the acumen of AIOps—oversees the harmony, tempo, and output of the orchestral ensemble, ensuring each section, from server provisioning to code deployment, plays in synchrony. The virtuoso, in this case, is not merely a coordinator but an innovator that introduces novel rhythms and harmonies through self-learning algorithms, elevating the performance and reducing dissonances that can lead to system outages or delays.
The relevance and indispensability of AIOps in enhancing DevOps productivity are borne out in several dimensions. One key aspect is the automation of routine and mundane tasks which historically were the purview of IT operations personnel. By automating such tasks, AIOps frees up the human talent to focus on more strategic, creative endeavors that drive business value. For example, in the case of continuous integration and deployment (CI/CD) pipelines—a staple in DevOps—AIOps can automatically trigger, manage, and optimize build and deployment processes. This ensures that software updates and patches are delivered with higher frequency and reliability, significantly reducing lead times for changes and fostering a culture of continuous improvement.
Moreover, the predictive capabilities of AIOps constitute a vanguard against IT anomalies and failures. Through the application of ML algorithms to historical data, AIOps platforms can anticipate and mitigate potential system bottlenecks or outages before they manifest. This foresight is critical in maintaining the high-velocity, high-availability ethos central to DevOps. An instance illustrating this is the AIOps-driven anomaly detection, where the system, upon identifying a deviation from the norm, can alert the team or autonomously initiate corrective measures, thereby averting a cascading failure that could disrupt service delivery.
In addition to task automation and predictive analytics, AIOps enhances DevOps productivity through intelligent insights and decision-making support. Through the aggregation and analysis of cross-domain data, AIOps provides holistic visibility into system performance, infrastructure health, and user experience. This panoramic view enables DevOps teams to make informed, data-driven decisions that align IT operations with business objectives.
Yet, another dimension where AIOps amplifies DevOps is in its capacity to facilitate seamless collaboration between cross-functional teams. The platform acts as a central nervous system, integrating and interpreting data from various tools and teams, which fosters a coherent understanding of IT operations across the organization. By breaking down silos and centralizing insights, AIOps ensures that everyone from developers to operation engineers is aligned, fostering a collective responsibility for the system’s health and performance.
Furthermore, AIOps brings financial benefits to the table by driving efficiency gains that ripple through the entire IT operation. By minimizing downtime, expediting mean time to resolution, and optimizing resource utilization, organizations can realize tangible cost savings. This financial aspect is not simply about cutting costs but also about enabling a dynamic allocation of resources where and when they are needed, thereby maximizing return on investment. The reduction in downtime alone not only spares revenue loss but also protects the brand reputation, which, although not directly quantifiable, has significant long-term financial implications.
When visualizing the intertwining of AI and DevOps, one might imagine an intricate network, where data flows like electricity through a complex circuitry, being continuously monitored, analyzed, and acted upon by AI. This network represents the modern IT infrastructure, a pulsating digital entity, where AIOps operates at the nerve center, ensuring that data translates into actionable intelligence, that issues are not just resolved but preempted, and that the delivery of IT services is not just efficient but also resilient and adaptive.
The advent of AIOps marks a new epoch in IT operations, one where the traditional boundaries of human and machine collaboration are redrawn, and where the productivity and financial levers of DevOps are amplified to unprecedented levels. As organizations continue to navigate the tides of digital transformation, the synergy between AI and DevOps, embodied in AIOps, emerges as the quintessential compass guiding them towards a horizon of limitless potential.
AIOps in Healthcare: Improving Patient Outcomes and Operational Efficiency
As AIOps advances the frontier of IT operations, its transformative power is particularly palpable in the healthcare sector, an industry critically dependent on reliable and efficient IT systems for patient care. The integration of artificial intelligence into healthcare IT operations is not merely a technical enhancement but a catalyst for life-saving improvements and operational excellence.
A case in point is the application of AIOps in patient monitoring systems. These systems are integral to patient care, collecting vast amounts of data from various medical devices. AIOps platforms can aggregate this data in real-time, apply predictive analytics, and flag any anomalies that could indicate a patient’s deterioration before it becomes critical. For instance, predictive algorithms can spot subtle changes in a patient’s vital signs, alerting healthcare providers to take preemptive measures. The deployment of AIOps in such scenarios has shown to improve patient outcomes significantly by providing healthcare professionals with actionable insights, allowing for earlier interventions.
The case of TidalHealth Peninsula Regional, as reported in recent industry analyses, exemplifies the strategic use of AIOps to enhance clinical decision support. Through AIOps, TidalHealth was able to analyze electronic health records (EHR) and other relevant patient data to guide treatments, manage risks, and anticipate needs, resulting in a more responsive and personalized patient care approach.
Moreover, AI-driven operational intelligence in healthcare settings extends to managing IT infrastructure with increased effectiveness. A study from the Health Management Academy found that nearly half of the health systems were utilizing AI solutions to address workforce challenges. The application of AIOps enabled these systems to allocate human resources more strategically, relying on AI to handle routine IT tasks and thereby freeing staff to focus on patient-oriented activities.
AIOps also plays a crucial role in managing the extensive data generated within healthcare environments, ranging from patient records to imaging data. As detailed in a study by Cognizant, by using AI to analyze patterns within this data, healthcare providers can gain insights into operational bottlenecks, claim rejections, and back-office performance, leading to operational efficiencies and cost savings.
In healthcare IT, uptime is non-negotiable, and AIOps significantly reduces downtime through proactive incident prediction and prevention. The Journal of mHealth highlights several use cases for AI in healthcare, such as monitoring patient conditions, which directly translate to AIOps’ ability to predict system failures that could impact patient care. By ensuring the high availability of IT systems, AIOps indirectly contributes to the uninterrupted delivery of healthcare services.
Furthermore, AIOps enhances the security posture of healthcare IT environments, a critical consideration given the sensitivity of health data. By continuously monitoring network traffic and access patterns, AIOps can quickly detect anomalies that may signal a cybersecurity threat, enabling rapid response to potential breaches.
In the realm of cloud services for healthcare, AIOps is a game-changer, allowing for the seamless operation of cloud-based EHRs and telemedicine platforms. Healthcare IT Today discusses how AIOps ensures these cloud services are consistently available, properly scaled, and efficiently managed to deliver personalized healthcare services. This is increasingly crucial as telemedicine becomes an integrated component of patient care, where even minor system lags can disrupt the delivery of healthcare services.
Cost savings through AIOps are substantial, as healthcare organizations often operate on tight budgets. By automating routine IT tasks, organizations can reduce labor costs and minimize expensive downtime. AIOps facilitates this through efficient resource allocation, dynamic system scaling based on demand, and optimization of IT operations, leading to a lower total cost of ownership for healthcare IT systems.
In the context of the COVID-19 pandemic, the agility afforded by AIOps has been critical. A case study by VKTR highlights how AIOps has been deployed to rapidly adapt healthcare IT systems to new demands, such as the shift to virtual care and the need for intensive data analysis to understand and respond to the virus. This responsiveness is essential not only for patient care but also for maintaining operational continuity under unprecedented strain.
In essence, AIOps in healthcare is not solely about optimizing IT operations but is intricately linked to the overarching goal of enhancing patient care. Its ability to process, analyze, and act upon data in a fraction of the time it takes through conventional means marks a significant leap forward for the healthcare sector. As AIOps continues to mature, its potential to support an ever-growing range of healthcare IT functions is boundless, hinting at a future where the responsiveness and precision of medical care are substantially elevated by the insights and efficiency driven by artificial intelligence.
AIOps and Cloud Businesses: Accelerating Innovation and Cost Efficiency
AIOps is making a significant impact in the realm of cloud businesses, serving as an engine for innovation and a lever for cost-efficiency. With cloud computing being the backbone of the digital economy, the stakes for maintaining seamless operations are incredibly high. AIOps, with its advanced machine learning algorithms and big data analytics, is perfectly poised to meet these demands.
Within the cloud environment, one of AIOps’ primary roles is to automate the maintenance and optimization of IT systems. This is a game-changer for cloud businesses that operate at scale and must manage complex infrastructures. By implementing AIOps solutions, these businesses can automate their monitoring and response systems, preemptively identifying and resolving issues before they escalate into major disruptions.
For instance, let’s consider the management of multi-cloud environments. As businesses expand their cloud footprint across different providers and services, the complexity of managing these diverse infrastructures grows exponentially. AIOps simplifies this complexity by providing a unified view of multi-cloud environments. It can automatically analyze performance data across all clouds and apply predictive analytics to optimize resource allocation. This not only enhances performance but also eliminates the overspending on underutilized resources—a common inefficiency in cloud management.
The financial benefits of such automation and optimization are compelling. In a study conducted by IDC, businesses reported an average of 15% reduction in IT operational costs after the adoption of AIOps. This figure encapsulates various cost-saving aspects, from reduced downtime to the less tangible but equally important benefits of agility and rapid response to market changes.
Another important aspect of AIOps in cloud businesses is its capacity to drive innovation. As AIOps handles routine and repetitive tasks, it frees up the human workforce to focus on creative and strategic endeavors. This shift from maintenance to innovation cannot be understated, as it allows technical teams to design new solutions, improve existing services, and think critically about future technology directions.
The observability provided by AIOps platforms is another key benefit. The ability to observe and understand the state of cloud services at any moment in time ensures that businesses can maintain optimal performance levels. Enhanced observability through AIOps translates into a better user experience and, consequently, customer satisfaction and loyalty. It’s a direct link between operational efficiency and revenue growth.
Financially, the preemptive nature of AIOps also contributes to avoiding losses related to system outages or failures. An outage can be exceedingly costly for cloud businesses not just in direct revenue loss but in reputational damage and customer trust. The Ponemon Institute found that the average cost of a data center outage has increased to over $740,000, with maximum costs soaring into the millions. Through predictive analytics and real-time decision-making capabilities, AIOps plays an instrumental role in preventing such expensive outages.
Furthermore, the adoption of AIOps has a marked impact on the velocity of cloud service delivery. Through continuous integration and continuous deployment (CI/CD) processes enhanced by AI, cloud services can be updated and improved with greater speed and accuracy. This rapid pace of development not only keeps businesses ahead in terms of innovation but also translates into financial gains by shortening the time-to-market for new features and services.
An excellent demonstration of AIOps’ financial benefits in cloud businesses is the deployment of intelligent automation in resource scaling. By analyzing application usage patterns, AIOps can dynamically scale resources up or down, ensuring that cloud environments operate at the intersection of performance and cost-efficiency. Notably, Google’s cloud services provide insights into how AIOps can yield improved cost management. According to Google, incorporating AI into cloud operations enables businesses to achieve better cost-to-performance ratios through more precise resource scaling, saving them an average of 20-30% on operational costs.
Additionally, the integration of AIOps can streamline the cloud migration process. As businesses transition to cloud-based infrastructures, AIOps can forecast migration outcomes, suggest optimal migration strategies, and oversee the process to reduce the risk of data loss or downtime. This not only ensures a smooth transition but also optimizes financial resources by preventing costly errors during the migration.
AIOps also plays a central role in cloud security, an area where financial implications are paramount given the potential cost of breaches and compliance violations. By continuously monitoring and analyzing security data, AIOps tools can detect anomalies that could indicate a security threat, enabling businesses to respond to potential issues swiftly and mitigate financial risks associated with cybersecurity incidents.
In the end, AIOps stands out as a transformative element for cloud businesses, not only elevating their technical capabilities but also providing a clear pathway to financial optimization. The intelligent, data-driven insights that AIOps platforms deliver empower organizations to allocate their budgets more effectively, reduce waste, and fuel ongoing innovation. As cloud businesses continue to expand and evolve, AIOps is rapidly becoming a critical factor for achieving both operational excellence and financial success.
Revolutionizing IT Operational Processes with AIOps
The transformative impact of AIOps on IT operational processes is profound, reshaping the landscape of IT management and productivity. By infusing artificial intelligence into the heart of IT operations, organizations can transcend the limitations of traditional IT practices and embrace a future where systems are self-monitoring, self-diagnosing, and self-healing. This section delves into the real-world application of AIOps, showcasing productivity gains through data and examples.
Let’s start with incident management, an area where AIOps has been revolutionary. Consider the case of a leading telecommunications company that faced challenges with service outages and disruptions. By deploying an AIOps platform, the company transformed its incident management process. The platform’s AI-driven predictive capabilities facilitated early detection of anomalies and potential failures in the network. This allowed the company to proactively address issues before they impacted customers. As a result, the mean time to detection (MTTD) was reduced by 60%, and the mean time to resolution (MTTR) decreased by 40%. The ripple effect was not just operational but also financial, with the company observing a significant reduction in the cost associated with outages, estimated at an annual saving of millions of dollars.
Another aspect where AIOps has delivered remarkable productivity gains is in problem management. AIOps platforms are particularly adept at correlating data from disparate sources, identifying patterns, and diagnosing underlying systemic issues that could lead to repeated incidents. By automating the root cause analysis, IT teams can focus on higher-value tasks like remediation and prevention strategies. For instance, a European bank leveraged AIOps to analyze millions of events and logs, successfully isolating a recurring issue in their payment processing system. Through machine learning algorithms, the AIOps solution identified a pattern that eluded human analysts and provided actionable insights, resulting in an 80% reduction in problem recurrence.
Change management, too, has been redefined by AIOps. Changes in IT infrastructure are a necessary aspect of digital innovation but often carry the risk of creating new issues. AIOps introduces a level of intelligence into the change management process by predicting the impact of proposed changes on the IT environment. An example is a global e-commerce company that integrated AIOps into its change management workflow. The AI algorithms predicted the outcome of various change scenarios, reducing failed changes by approximately 25%. This capability ensured smoother rollouts of new features and updates, contributing to enhanced customer experiences and trust.
AIOps has also streamlined the management of multi-cloud environments. By offering comprehensive visibility across all cloud services, AIOps platforms allow IT operations teams to optimize deployments and reallocate resources based on actual usage patterns. A cloud service provider reported that through the utilization of AIOps for their multi-cloud management, they achieved a 30% reduction in cloud wastage by right-sizing resources and automating scaling based on demand prediction. This strategic resource allocation translated into not only better performance but also cost-efficiency and an enhanced competitive edge in the market.
The journey towards proactive and predictive management of IT environments is being accelerated by AIOps. By shifting from a reactive stance to a proactive and predictive one, organizations can avert incidents and enhance service availability. A high-profile case where AIOps’ predictive capabilities demonstrated immense value was in a major airline’s IT operations. The AIOps platform used historical data to forecast possible disruptions in the ticketing system, allowing the airline to mitigate risks during peak travel seasons. The proactive approach avoided potential revenue loss due to system unavailability and ensured a smooth experience for travelers and staff alike.
Moreover, by aggregating and analyzing massive volumes of operational data, AIOps tools have empowered IT leaders with granular insights into the performance of their systems. They can now make informed decisions on IT investments, infrastructure scaling, and service optimization. In essence, AIOps has become the lynchpin for ensuring that IT operational processes are not just efficient but also aligned with the strategic goals of the organization.
In conclusion, as AIOps continues to evolve and integrate more deeply into IT operations, we can expect further productivity enhancements and cost efficiencies. These improvements are not only reflected in the bottom line but also in the agility of businesses to respond to rapidly changing market dynamics. With AI poised to delve deeper into operational decision-making, IT operations are set to become an even more critical driver of business success in the digital age.
The Financial Implications of Adopting AIOps
The advent of AIOps has redefined the financial landscape for organizations worldwide, ushering in an era where operational efficiency and financial optimization go hand in hand. This nexus of IT and economics is most clearly observed in the granular details of financial reports and data-driven studies, which provide tangible proof of AIOps’ economic benefits. Let’s delve into these implications by scrutinizing various dimensions through which AIOps is facilitating a new financial paradigm.
Cost Reduction Through Automation
Automation, the backbone of AIOps, presents a two-pronged economic advantage. Firstly, by automating routine and repetitive tasks, AIOps significantly diminishes the need for manual intervention, which translates into direct labor cost savings. According to an IBM report, the benefit of AIOps is its capability to make critical operational decisions autonomously, thereby optimizing cloud costs and IT spending.
Furthermore, by reducing human involvement, AIOps minimizes the potential for error-induced downtime, which can be financially catastrophic. ZIF.AI’s financial analysis reinforces this point, stating that enterprises adopting AIOps enjoy higher uptime and ROI due to the technology’s ability to preempt and resolve issues without manual input.
Increased Operational Efficiency
Efficiency is another avenue where AIOps promises significant financial returns. By enabling organizations to process and analyze IT data at scale, AIOps tools help pinpoint inefficiencies within systems. Companies that have embraced AIOps report enhanced operational confidence and the ability to manage vulnerability risks more effectively. Red Hat’s insights confirm that AIOps paves the way for a more focused approach to managing IT operations, thereby enhancing resource utilization and efficiency.
The link between operational efficiency and financial performance is well-established. With AIOps providing a clearer view of the IT infrastructure, businesses are better equipped to allocate resources wisely, ensuring that every dollar spent on IT yields a tangible return in terms of system performance and reliability.
Downtime and Its Financial Impact
Downtime is anathema to profitability. Any instance of system unavailability can result in lost revenue, decreased productivity, and eroded customer trust. AIOps’ value proposition, in this context, is its ability to significantly reduce downtime. Aisera’s analysis on AIOps benefits emphasizes its role in lessening downtime, enhancing service availability, and consequently, protecting the bottom line. By offering predictive analytics, AIOps enables organizations to foresee and address IT issues before they spiral into full-blown outages.
In the financial services sector, the stability and availability of systems are especially crucial. Broadcom Inc. outlines that AIOps contributes to optimized user experiences and maximized operational efficiency, essential in an industry where downtime can equate to millions in lost transactions and customer dissatisfaction.
Resource Optimization and Cloud Expenditure
As companies migrate to cloud services, the challenge of managing and optimizing cloud-related expenses has become increasingly significant. AIOps offers a solution by providing AI-driven insights into the utilization and performance of cloud resources. The financial benefits here include avoidance of over-provisioning and ensuring that companies pay only for the resources they need, as highlighted by the IBM Blog. In essence, AIOps equips businesses to fine-tune their cloud investments, turning potential financial sinkholes into areas of strategic expenditure.
ROI and Customer Satisfaction
Return on investment (ROI) is an essential metric for assessing any technology’s financial impact, including AIOps. Higher uptime, streamlined operations, and improved problem-resolution capabilities have been associated with a better ROI for businesses adopting AIOps. Furthermore, the technology’s contribution to the customer experience cannot be overstated. Pluralsight elucidates that AIOps boosts the reliability and availability of support teams, leading to a superior customer experience. Since satisfied customers are more likely to engage in repeat business and advocate for the brand, AIOps can indirectly influence revenue generation and market share expansion.
Long-term Strategic Benefits
Beyond the immediate financial benefits, AIOps plays a role in positioning organizations strategically for the future. As businesses are forced to grapple with increasing IT complexity and escalating customer demands, AIOps provides a way to navigate these challenges effectively. The financial implications of being strategically ahead cannot be discounted; they include attracting more customers, entering new markets, and innovating rapidly—all of which contribute to the long-term financial health and growth of an organization.
In conclusion, when we consider the economic impact of AIOps, it’s evident that its influence transcends mere cost-cutting. AIOps has become a fundamental driver of financial performance, enabling organizations to leverage IT operations not just as a support function but as a strategic asset that drives growth and competitiveness. It’s in this granular, financially quantifiable arena that the true economic narrative of AIOps is written—a narrative of enhanced profitability, operational excellence, and strategic foresight.
Cultural Transformation: Collaborative Innovation in IT Teams
Cultural Transformation: Collaborative Innovation in IT Teams
Cultural transformation within IT teams is a subtle yet powerful tide that often goes unnoticed in the wake of technological upheavals like the advent of AIOps. AIOps doesn’t just represent an array of tools or a subset of AI applications; it embodies a shift in philosophy and approach to IT operations, which has profound implications on team dynamics, collaboration, and innovation. At the core of this transformation is the interplay between human intelligence and artificial intelligence, primarily between DevOps engineers and AI systems, which reshapes workplace culture towards a more holistic, responsive, and innovative environment.
Traditionally, IT operations have been governed by sets of rules and processes with a clear demarcation of roles and responsibilities. However, AIOps brings a level of dynamism into these processes by harnessing the power of AI to make decisions, predict outcomes, and automate actions. This has significant consequences for the roles of DevOps engineers, who now need to pivot from being just the executors of IT tasks to becoming architects and strategists of AI-driven operations.
This role evolution necessitates the development of new skill sets among IT professionals. As AI takes over routine and predictable tasks, DevOps engineers are tasked with the challenge of interpreting AI-driven insights and translating them into actionable strategies. This requires a deep understanding of both the business goals and the underlying AI technologies, fostering a culture of continuous learning and skill enhancement.
Collaboration emerges as a central theme in this new culture. DevOps teams now work closely with data scientists and AI specialists to develop, train, and manage AI models and algorithms that underpin AIOps solutions. This cross-pollination of ideas and expertise creates an interdisciplinary environment that is fertile ground for innovation. The sharing of knowledge between these groups helps in creating robust AI systems that can more effectively manage and automate complex IT operations.
Moreover, collaborative innovation in the context of AIOps extends beyond internal team dynamics. It is also about partnering with other departments within the organization such as customer service, sales, and marketing. For instance, insights from AIOps can be used to inform customer service teams about potential issues before they escalate, allowing for a more proactive approach to customer relations. Similarly, sales and marketing can leverage uptime statistics and system performance data to highlight the reliability of the company’s services to prospects.
The need for proactive management of IT operations fosters a culture of anticipation rather than reaction. In such an environment, DevOps engineers and AI systems work together to identify and address anomalies before they manifest as operational issues. This predictive approach not only improves system reliability but also empowers teams to focus on strategic initiatives rather than being bogged down by unforeseen crises.
An essential part of the cultural transformation driven by AIOps is the shift towards a mindset of experimentation and adaptability. With AI capable of rapidly processing large volumes of data and providing insights, IT teams are encouraged to experiment with new configurations, policies, and processes. This culture of experimentation is supported by the safety net that AIOps provides—since potential negative outcomes can be predicted and mitigated in advance, there is less risk associated with trying new approaches. This leads to a more dynamic and agile IT operation, where changes can be implemented and rolled back swiftly, keeping pace with the fast-evolving business and technology landscapes.
The implementation of AIOps also drives cultural change by emphasizing the value of data-driven decision-making. Data lies at the heart of all AIOps activities, and its correct interpretation is critical. By ingraining the importance of data in the organization’s culture, teams develop a keenness for metrics and analytics. DevOps engineers begin to see patterns and correlations that were not apparent before, leading to better decisions about system design, resource allocation, and incident response.
Another cultural shift brought about by the integration of AIOps is the move towards enhanced collaboration tools and platforms. Communication and information sharing are pivotal in managing AI-driven operations, which means that collaborative tools become essential in day-to-day activities. Platforms that facilitate seamless information flow and provide centralized dashboards for monitoring AI insights help create a transparent and informed work environment.
All these cultural changes—ongoing learning, cross-disciplinary collaboration, proactive management, experimentation, data-driven decision-making, and the use of collaborative tools—create an environment where innovation is not just encouraged but becomes an organic part of the workflow. This environment is resilient to the inevitable changes brought about by digital transformation and well-equipped to leverage AIOps for not only improving IT operations but also driving business growth.
As organizations grow increasingly dependent on technology for their operations and customer interactions, the role of IT teams and the effectiveness of their collaborations with AI systems become more critical. AIOps is at the forefront of this evolution, driving the necessary cultural changes to ensure that IT teams are not merely responding to technology trends but are actively shaping and guiding them. This collaborative innovation is pivotal for maintaining the competitive edge in an era where agility, foresight, and strategic use of technology define market leaders.
AIOps: A Catalyst for Business Strategy and Competitive Advantage
AIOps stands not merely as a set of tools or methodologies; it serves as a strategic enabler, a pivot around which contemporary businesses reorient their IT operations and, by extension, their overall strategic outlook. As enterprises adopt AIOps, they are not just streamlining their operations or enhancing productivity—they are redefining their competitive edge in a market where agility and foresight are crucial.
Consider the nature of competition in the digital era: it’s swift, it’s global, and it’s relentless. Organizations are under constant pressure to innovate, to deliver services and products faster, more reliably, and with higher quality than ever before. AIOps emerges as a key differentiator in this arena. It confers the ability to predict and preempt operational issues, to deploy resources with precision, and to provide insights that lead to better customer experiences and outcomes.
The strategic impact of AIOps can be dissected into several focal areas. First is the operational resilience it provides. Businesses with AIOps capabilities have a significant advantage when it comes to maintaining continuous operations—even in the face of complex IT ecosystems that span on-premises, cloud, and hybrid environments. With its predictive analytics and automated response mechanisms, AIOps ensures that potential disruptions are addressed before they impact business continuity, thereby bolstering the organization’s reliability and reputation.
Resource optimization is another domain where AIOps shines as a strategic asset. With traditional IT management, resources are often allocated based on estimations or reactive adjustments. AIOps, on the other hand, utilizes AI to dynamically adjust resources in real-time, ensuring that applications and services are running at peak efficiency without wastage. This level of optimization translates directly into cost savings and enhances the ability to scale operations to meet demand without overspending.
Furthermore, the strategic adoption of AIOps streamlines the transition to and utilization of cloud infrastructures—a critical component of modern business strategies. Cloud environments are complex, and their effective management requires sophisticated toolsets that can handle multi-cloud and hybrid systems. AIOps provides the analytics and automation necessary to manage these environments effectively, ensuring that businesses can fully leverage the agility and scalability of cloud services.
One cannot overlook the cultural shift that AIOps induces within IT teams. By fostering a collaborative environment where AI systems and DevOps engineers innovate together, businesses create a workforce that is not just technically proficient but also strategically aligned with the organization’s goals. This culture of innovation becomes an incubator for new ideas and approaches that can keep a business at the leading edge of its industry.
At a more granular level, AIOps significantly enhances incident management and response times, making DevOps teams dramatically more productive. With the automation of mundane tasks and the provision of actionable insights, DevOps can focus on strategic tasks that add real value to the business. This increased productivity is not just about doing more with less; it’s about enabling high-value activities that can directly contribute to business goals.
In terms of customer experience, AIOps equips businesses with the tools to deliver seamless, uninterrupted services. In a digital marketplace where users expect 24/7 availability and instant support, the ability to meet these expectations becomes a potent competitive lever. AIOps-driven insights allow for a more personalized user experience, anticipating needs and solving problems often before the user is even aware of them.
The financial benefits of adopting AIOps are both direct and indirect. Reductions in downtime, enhanced productivity, and resource optimization all contribute to a healthier bottom line. Indirectly, these operational efficiencies and the ability to meet and exceed customer expectations drive revenue growth. AIOps thus plays a crucial role in both cost control and revenue generation strategies.
As the business landscape continues to evolve, the data-centric approach of AIOps will only increase in relevance. Data is the lifeblood of strategic decision-making, and AIOps ensures that organizations have the most relevant, actionable data at their fingertips. This capability allows businesses to be more responsive to market changes, to customer needs, and to internal process improvements.
The adoption of AIOps is not just an operational decision; it’s a strategic one that positions businesses for long-term success. Those who integrate AIOps into their operations gain a holistic view of their IT environments, an enhanced ability to predict and respond to issues, and a culture of innovation that drives continuous improvement. It is this comprehensive impact on both the IT and business landscapes that cements AIOps as a competitive differentiator and a strategic enabler for forward-thinking organizations.
To learn more on how to implement AIOps, click Here to schedule a call with our experts.
Unlocking Efficiency: The Significance of Digital Operations for Modern Enterprises
Understanding Digital Operations:
Digital operations encompass a range of activities, including IT service management, DevOps, automation, data analytics, and artificial intelligence. By integrating digital technologies and data-driven decision-making, organizations can simplify complex workflows, enhance collaboration, and drive operational excellence. Unlocking the potential of digital tools and platforms empowers enterprises to achieve agility, scalability, and adaptability in their day-to-day operations.
The Importance of Digital Operations:
1. Streamlining Operations:
Digital operations eliminate manual processes and automate repetitive tasks, freeing up valuable resources. By optimizing workflows and reducing errors, organizations achieve enhanced efficiency and productivity. McKinsey reports that implementing digital operations can increase efficiency by 20-30%.
2. Faster Time-to-Resolution:
Digital operations enable swift problem resolution by leveraging real-time monitoring, proactive alerting, and automated incident response. This reduces downtime and service disruptions, resulting in improved Mean Time to Resolution (MTTR). Gartner’s survey reveals that advanced digital operations reduce MTTR by 40%, fostering enhanced customer satisfaction and loyalty.
3. Enhancing Customer Experience:
Digital operations enable organizations to derive actionable insights from customer data, providing personalized experiences and targeted services. By leveraging analytics and artificial intelligence, businesses anticipate customer needs, deliver seamless experiences, and build long-term relationships. Salesforce reports that 84% of customers consider experience as important as products and services.
4. Enabling Scalability and Agility:
In a dynamic digital landscape, agility and scalability are crucial for organizational success. Digital operations provide the foundation for rapid innovation, iterative development, and continuous integration. Embracing a DevOps culture and leveraging cloud computing allow organizations to adapt to market demands quickly. This flexibility helps stay competitive and meet customer expectations.
5. Driving Cost Optimization:
Digital operations optimize costs by reducing manual effort, improving resource utilization, and optimizing infrastructure. Automating routine tasks allows organizations to focus resources on value-added activities, resulting in cost savings and improved profitability. Deloitte’s study reveals that digital operations can reduce operational costs by up to 30%.
Testimonial: The Power of Digital Operations – A CTO’s Perspective:
As the CTO of Webiscope, I’ve witnessed the transformative impact of digital operations on our clients. Automation and data-driven decision-making have significantly improved their operational efficiency and reduced their downtime. We have seen Mean Time to Resolution decreased by 50%, enabling exceptional service delivery. Embracing a culture of continuous improvement and agility has accelerated their time-to-market, securing a competitive edge.
Conclusion:
In the era of digital transformation, digital operations play a vital role in achieving operational excellence, exceptional customer experiences, and improved bottom-line growth. By harnessing the power of automation, data analytics, and artificial intelligence, enterprises unlock efficiency, streamline processes, and adapt to changing market demands. Embracing digital operations paves the way for organizational success in the digital age.
References:
1. McKinsey & Company. (n.d.). Digital McKinsey.
2. Gartner. (n.d.). Gartner IT Glossary: Mean Time to Resolution (MTTR).
4. Deloitte. (n.d.). Digital Operations: Transforming a Core Business.
5. DevOps Institute. (n.d.). The Upskilling 2021: Enterprise DevOps Skills Report.
To learn more about how to implement Digital Operations in your organization, schedule a call with us today
Unlocking the Power of Full Stack Observability
In today’s rapidly evolving digital landscape, companies face a multitude of challenges when it comes to monitoring, maintaining and optimizing their IT infrastructure. This is where Full Stack Observability comes in. Full Stack Observability is the practice of collecting, correlating, and analyzing all relevant data from a company’s infrastructure, application, and user interactions to provide comprehensive insights into system performance and end-user experience. It enables companies to identify and resolve issues before they impact users, optimize system performance, and make informed decisions about their IT investments.
Financial Benefits of Full Stack Observability
Implementing Full Stack Observability can have a significant impact on a company’s bottom line. By detecting and resolving issues quickly, companies can reduce downtime, improve system availability, and ultimately enhance the user experience. This, in turn, can lead to increased customer loyalty and revenue.
In addition, Full Stack Observability can help companies optimize their IT spending by identifying areas for improvement and allowing them to make informed decisions about where to invest their resources. For example, by identifying bottlenecks in the system, companies can prioritize investments in those areas to improve overall system performance.
Current Challenges in Full Stack Observability
While Full Stack Observability offers significant benefits, implementing it can be challenging. One of the biggest challenges is the sheer volume of data that needs to be collected and analyzed. With the proliferation of cloud-based applications and services, the amount of data generated can be overwhelming. It requires specialized tools and expertise to collect, correlate, and analyze the data effectively.
Another challenge is ensuring that the data collected is relevant and actionable. With so much data available, it can be easy to get lost in the noise and miss critical insights. To ensure that the data is meaningful, companies need to define clear metrics and thresholds and establish processes for interpreting the data and taking action.
The Future of Full Stack Observability
Despite the challenges, the future of Full Stack Observability looks bright. With the continued growth of cloud-based applications and services, the need for comprehensive monitoring and analysis will only increase. Advances in machine learning and AI will make it easier to automate the collection and analysis of data, enabling companies to identify issues more quickly and accurately.
In addition, the rise of DevOps and Site Reliability Engineering (SRE) has led to a greater focus on observability as a core component of system reliability. As companies continue to adopt these practices, Full Stack Observability will become even more critical to ensuring system performance and end-user experience.
How a Team of Experts in Observability Can Help
Given the challenges and complexities involved in Full Stack Observability, many companies are turning to specialized teams to help them implement and manage the process. These teams can bring the expertise and tools needed to collect, correlate, and analyze the data effectively, freeing up internal resources to focus on other critical tasks.
A team of observability experts can also help companies define clear metrics and thresholds, establish processes for interpreting data, and develop automated alerts and remediation processes. They can help ensure that the data collected is relevant and actionable, and that the insights generated are used to drive meaningful improvements in system performance and end-user experience.
In conclusion, Full Stack Observability offers significant financial benefits to companies by improving system performance, reducing downtime, and enhancing the user experience. While implementing Full Stack Observability can be challenging, the future looks bright with the continued growth of cloud-based applications and services and the rise of DevOps and SRE practices. A team of observability experts can help companies overcome these challenges and leverage the power of Full Stack Observability to drive meaningful improvements in their IT infrastructure.
To learn more about how you can reach Full Stack Observability, schedule a call with us today
To learn more about how Full-Stack Observability can help your organization, schedule a call with us today
Monitor OpenAI GPT application usage in New Relic
Monitor OpenAI with our integration
New Relic is focused on delivering valuable AI and ML tools that provide in-depth monitoring insights and integrate with your current technology stack. Our industry-first MLOps integration with OpenAI’s GPT-3, GPT-3.5, and beyond provides a seamless path for monitoring this service. Our lightweight library helps you monitor OpenAI completion queries and simultaneously records useful statistics around ChatGPT in a New Relic dashboard about your requests.
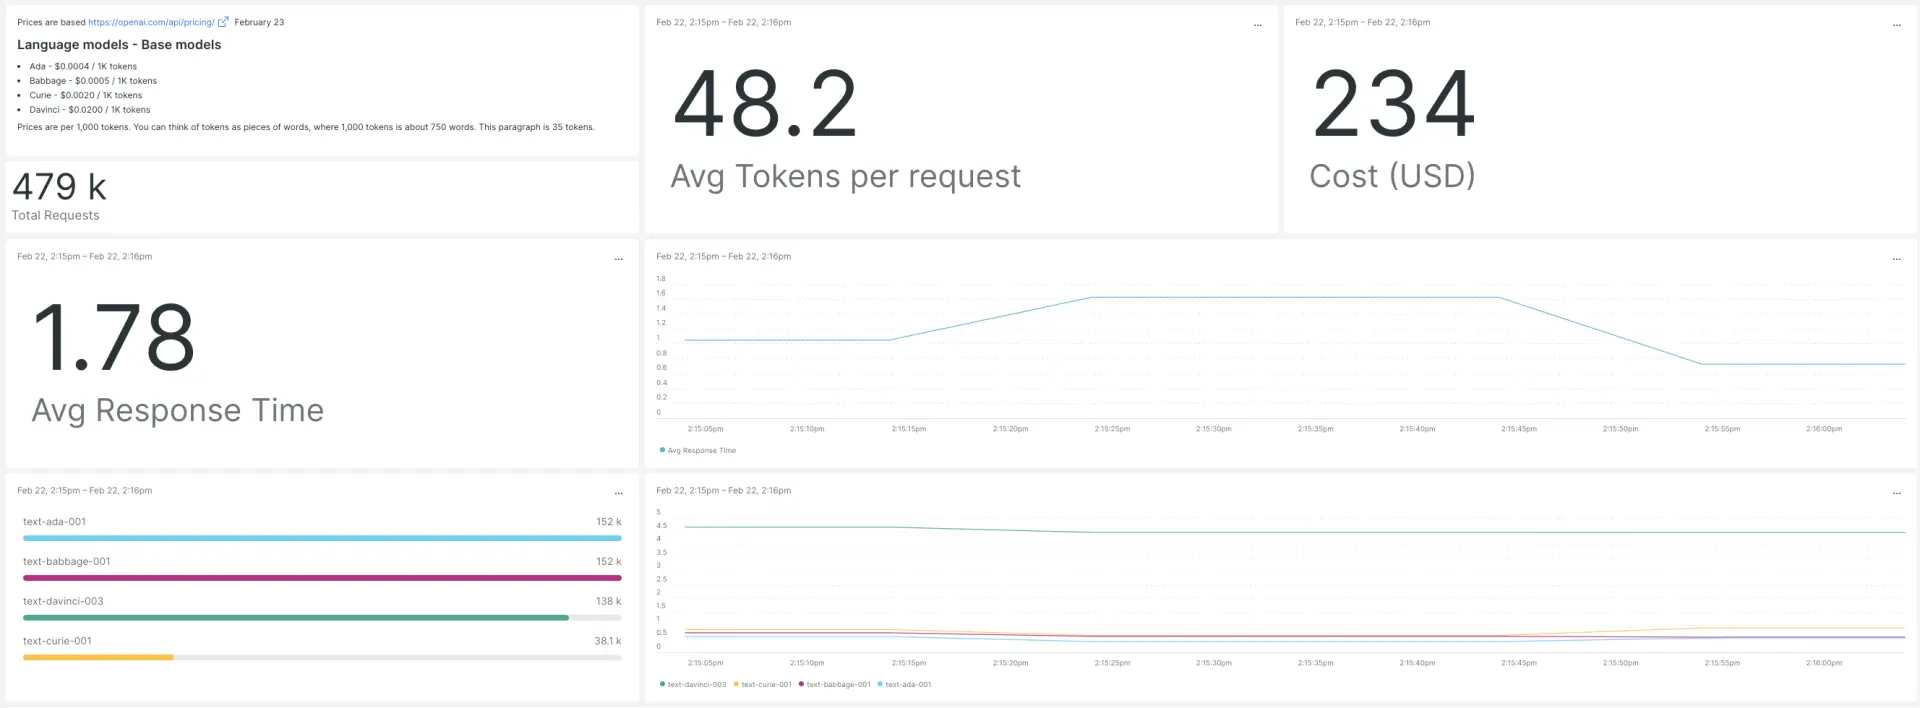
With just two lines of code, simply import the monitor module from the nr_openai_monitor library and automatically generate a dashboard that displays a variety of key GPT-3 and GPT-3.5 performance metrics such as cost, requests, average response time, and average tokens per request.
To get started, install the OpenAI Observability quickstart from New Relic Instant Observability (I/O). Watch the Data Bytes video or visit our library repo for further instructions on how to integrate New Relic with your GPT apps and deploy the custom dashboard.
Key observability metrics for GPT-3 and GPT-3.5
Using OpenAI’s most powerful Davinci model costs $0.12 per 1000 tokens, which can add up quickly and make it difficult to operate at scale. So one of the most valuable metrics you’ll want to monitor is the cost of operating ChatGPT. With the integration of GPT-3 and GPT-3.5 with New Relic, our dashboard provides you with real-time cost tracking, to surface the financial implications of your OpenAI usage and help you determine more efficient use cases.
Another important metric is average response time. The speed of your ChatGPT, Whisper API, and other GPT requests can help you improve your models and quickly deliver the value behind your OpenAI applications to your customers. Monitoring GPT-3 and GPT-3.5 with New Relic will give you insight into the performance of your OpenAI requests, so you can understand your usage, improve the efficiency of ML models, and ensure that you’re getting the best possible response times.
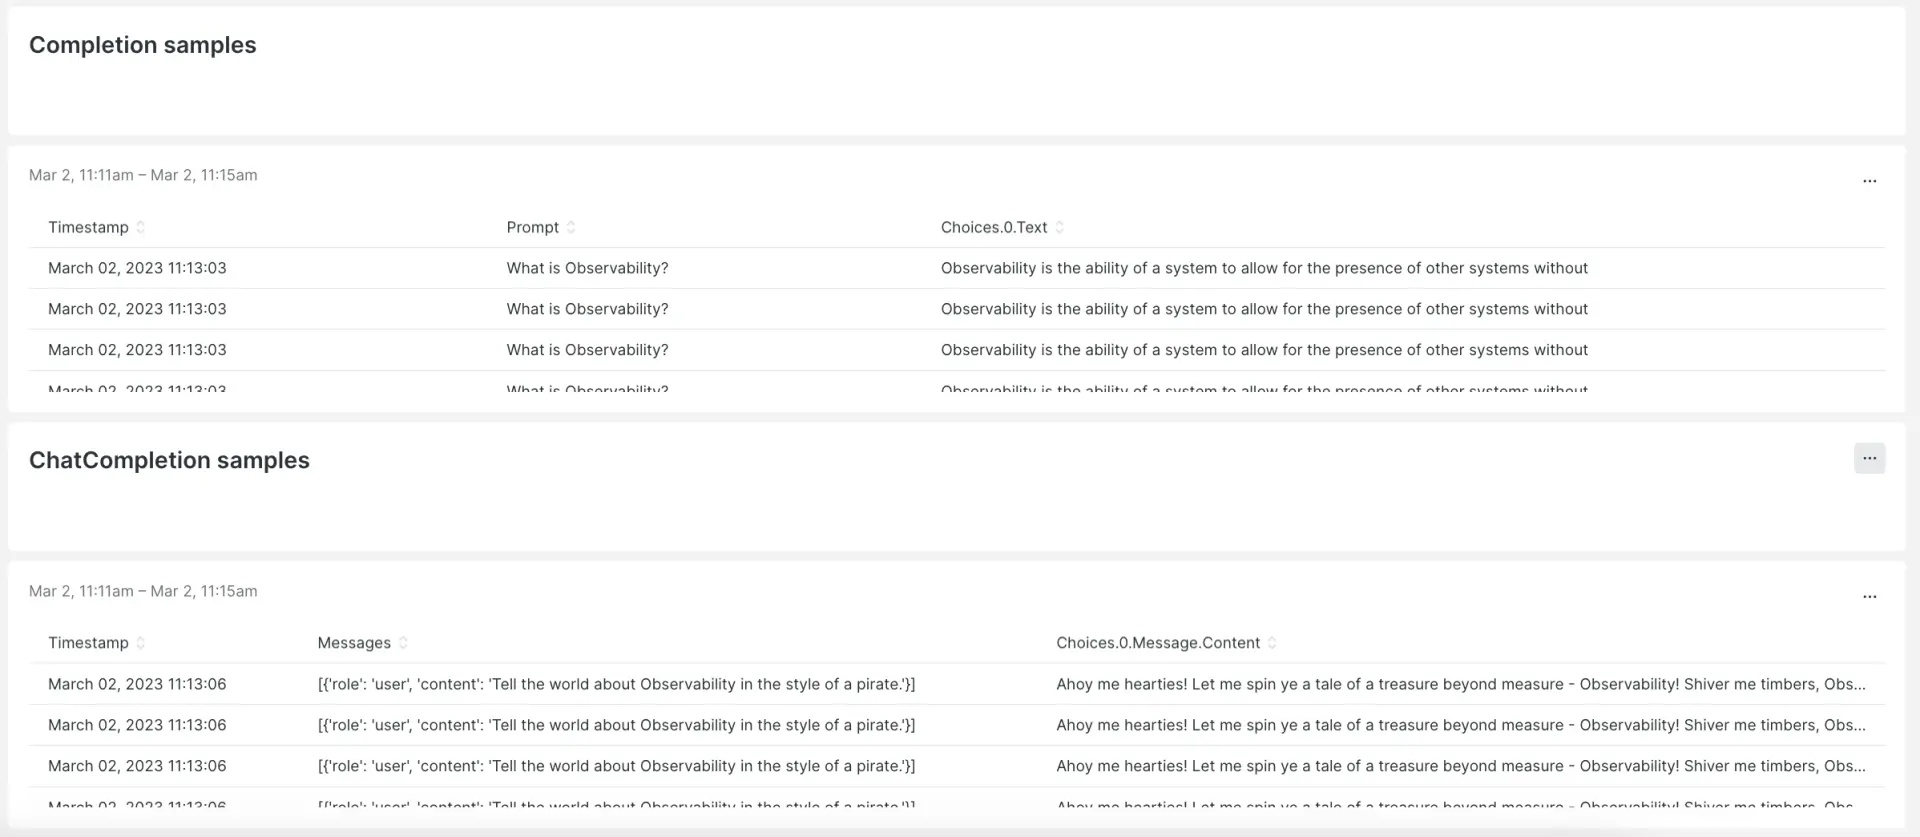
Other metrics included on the New Relic dashboard are total requests, average token/request, model names, and samples. These metrics provide valuable information about the usage and effectiveness of ChatGPT and OpenAI, and can help you enhance performance around your GPT use cases.
Overall, our OpenAI integration is fast, easy to use, and will get you access to real-time metrics that can help you optimize your usage, enhance ML models, reduce costs, and achieve better performance with your GPT-3 and GPT-3.5 models.
For more information on how to set up New Relic MLOps or integrate OpenAI’s GPT-3 and GPT-3.5 applications in your observability infrastructure, visit our MLOps documentationor our Instant Observability quickstart for OpenAI.
To learn more about how you can better observe your OpenAI usage, schedule a call with us today
eBPF + OpenTelemetry = The Perfect Match for Observability
In the world of modern software development, observability has become a critical aspect of ensuring reliable and performant applications. The combination of eBPF and OpenTelemetry provides a powerful set of tools for developers and DevOps teams to achieve this goal. In this article, we will explore the technical and commercial advantages of using these technologies together.
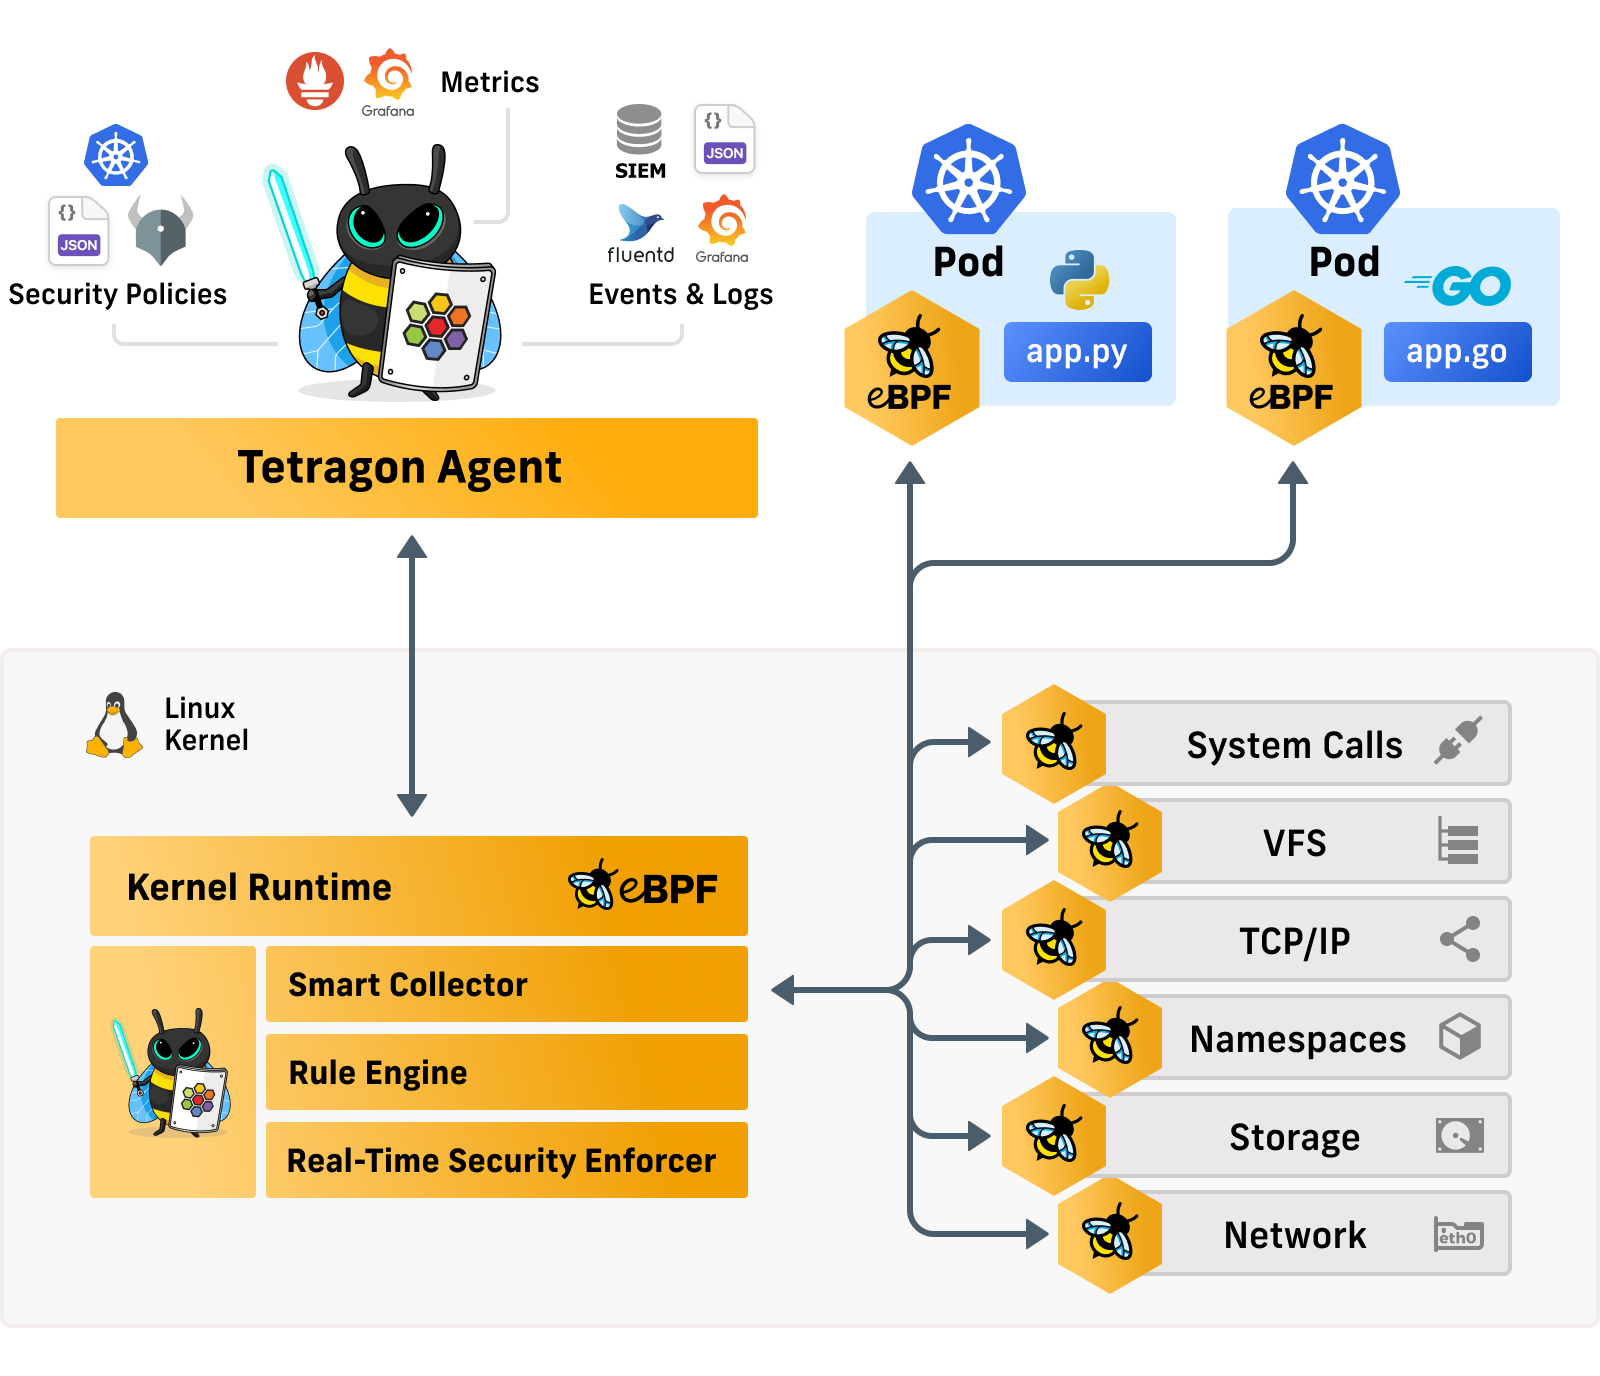
eBPF is a technology that allows developers to trace and monitor various aspects of a system, including network traffic and system calls, in real-time. It does this by allowing developers to write small programs that run in the Linux kernel. According to a recent article on The New Stack, “eBPF programs can be used to trace everything that happens within the kernel and on the user side, allowing for a comprehensive view of the system.” This allows developers to quickly identify issues and troubleshoot them more effectively.
OpenTelemetry is an open-source set of libraries and tools that allow developers to collect telemetry data from various sources. This data can be used to gain insights into the system and identify potential issues. According to a recent article on TechTarget, “OpenTelemetry allows developers to instrument code to generate telemetry data that can be collected and analyzed, providing a more comprehensive view of the system.” This allows developers to quickly identify and address issues, improving the overall reliability and performance of their applications.
One of the primary technical benefits of using eBPF and OpenTelemetry together is that they provide a comprehensive view of the system. According to a recent article on The New Stack, “eBPF and OpenTelemetry can work together to provide a more comprehensive view of the system, from the kernel to the application layer.” This allows developers to quickly identify issues and troubleshoot them more effectively.
Another technical benefit of using eBPF and OpenTelemetry is that they are highly scalable. According to a recent article on Cloudflare’s blog, “eBPF and OpenTelemetry are highly scalable, which makes them ideal for use in modern, complex software systems.” This scalability allows developers to monitor their systems effectively, even as they grow in complexity.
From a commercial perspective, the benefits of using eBPF and OpenTelemetry are significant. By quickly identifying and addressing issues, developers can improve the overall reliability and performance of their applications, reducing downtime and improving the customer experience. According to a recent article on Forbes, “observability is critical to ensuring the success of modern software applications, and eBPF and OpenTelemetry provide powerful tools for achieving this goal.” This, in turn, can lead to increased revenue and customer satisfaction.
Another commercial benefit of using eBPF and OpenTelemetry is that they can help reduce costs. By identifying and addressing issues quickly, developers can reduce the need for costly downtime and emergency fixes. According to a recent article on TechTarget, “observability can help reduce the overall cost of software development by identifying and addressing issues early in the development cycle.” This can lead to faster time-to-market and reduced development costs.
In conclusion, eBPF and OpenTelemetry provide powerful tools for achieving observability in modern software systems. These technologies provide a comprehensive view of the system, are highly scalable, and can help reduce costs and improve the customer experience. By using eBPF and OpenTelemetry together, developers and DevOps teams can quickly identify and address issues, improving the overall reliability and performance of their applications.
Do you want to learn more OR if you wish to implement eBPF and OpenTelemetry in your organization, SCHEDULE A CALL with us today
The business impact of Telemetry data
In today’s digital age, data is everything. It is the backbone of organizations and a driving force behind decision-making processes. One of the most important data types that companies collect is telemetry data. Telemetry data is a type of data that is collected from remote sensors and sent to a central location for analysis. The data is then used to monitor and optimize a wide range of systems, from industrial machinery to website performance. In this article, we will explore the business impact of telemetry data collection on organizations that collect such data.
Improved Operational Efficiency
Telemetry data is a valuable tool that can help organizations optimize their operations. By collecting data on everything from machine performance to supply chain logistics, organizations can identify areas for improvement and make data-driven decisions that lead to greater efficiency. According to a study by McKinsey, “Companies that leverage advanced analytics to improve their operational efficiency can reduce costs by up to 15%.” This is a significant improvement in profitability and can help organizations remain competitive in their respective markets.
Enhanced Product Development
Telemetry data can also be used to improve product development. By collecting data on how customers interact with products, organizations can identify areas for improvement and develop products that better meet the needs of their customers. This can lead to increased customer satisfaction, higher sales, and a competitive advantage in the marketplace. As Gartner notes, “Companies that use telemetry data to inform product development can reduce time-to-market by up to 50%.”
Predictive Maintenance
Telemetry data can be used to predict when maintenance is needed on equipment. This can help organizations avoid costly downtime and repairs, as well as extend the life of their equipment. According to Forbes, “Predictive maintenance can reduce maintenance costs by up to 30%, reduce downtime by up to 45%, and increase equipment uptime by up to 10%.” This can lead to significant improvements in operational efficiency and profitability.
Improved Customer Experience
Telemetry data can be used to improve the customer experience. By collecting data on customer behavior, preferences, and interactions with products and services, organizations can develop a better understanding of their customers’ needs and preferences. This can lead to more personalized customer experiences, increased customer loyalty, and higher sales. As Deloitte notes, “Telemetry data can help organizations provide a more personalized experience for customers, which can lead to increased customer loyalty and higher sales.”
Better Risk Management
Telemetry data can also be used to manage risk. By collecting data on everything from environmental conditions to equipment performance, organizations can identify potential risks and take proactive measures to mitigate them. This can help organizations avoid costly incidents and ensure regulatory compliance. As a report from Accenture notes, “Telemetry data can help organizations identify potential risks and take proactive measures to mitigate them, leading to better risk management and compliance.”
In conclusion, telemetry data collection has a significant impact on organizations that collect such data. It can improve operational efficiency, enhance product development, enable predictive maintenance, improve the customer experience, and support better risk management. By leveraging telemetry data, organizations can make data-driven decisions that lead to greater efficiency, profitability, and success in the marketplace.
References:
McKinsey & Company, “Advanced analytics in operations: A practical guide for achieving business impact,” 2019.
Gartner, “IoT analytics: Opportunities and challenges for marketers,” 2017.
Forbes, “Why Predictive Maintenance Is The Future Of Industrial IoT,” 2021.
Deloitte, “Telemetry in the automotive industry: The benefits and challenges,” 2021.
Accenture, “The role of telemetry in business operations,” 2019.
We are happy to announce that Webiscope is now part of Aman Group. We look forward giving our customers and partners greater value with more complete solutions and outstanding service.
This website uses cookies so that we can provide you with the best user experience possible. Cookie information is stored in your browser and performs functions such as recognising you when you return to our website and helping our team to understand which sections of the website you find most interesting and useful.
Strictly Necessary Cookies
Strictly Necessary Cookie should be enabled at all times so that we can save your preferences for cookie settings.
If you disable this cookie, we will not be able to save your preferences. This means that every time you visit this website you will need to enable or disable cookies again.