BOOK A DEMO

How to monitor with Prometheus

Prometheus has a dimensional data model, which is ideal for recording time series data—in other words, your metrics. It also includes PromQL, a powerful query language that helps you drill down into those metrics. Finally, Prometheus is extremely reliable because its servers are standalone and continue to operate even when other parts of your system are down.

In this article, you’ll learn the basics of how Prometheus collects data and how you can see your Prometheus metrics.

How does Prometheus collect data?

A Prometheus server collects metrics data from its targets using a pull model over HTTP. But what exactly is a pull model, and how is it different from a push model?

Push versus pull model

On a basic level, it really is as simple as it sounds. A Prometheus server pulls telemetry data from somewhere else. The server uses jobs to scrape HTTP endpoints. The data from those endpoints is then pulled into the Prometheus database.

push model collects data and then pushes it to a database. New Relic and other observability platforms use the push model. That means using instrumentation, the process of installing agents in your systems, to collect telemetry data. The agent, which is embedded in your software, collects the data and pushes it to another server.

Both push and pull methods work well for monitoring and observability, and OpenTelemetry (OTEL), which is open source and vendor-neutral, supports both methods.

Targets and jobs

A Prometheus server pulls its data by scraping HTTP endpoints. The endpoints provide a continuous stream, allowing the Prometheus server to collect real-time data. These endpoints are also known as targets or instances, and a collection of instances that have the same purpose is known as a job. Jobs are commonly used for scalability and reliability.

Exporters and native Prometheus endpoints

It may seem like a major limitation that Prometheus can only pull data from HTTP endpoints. However, sometimes you need to monitor data from things that don’t have HTTP endpoints such as proxies, hardware, and databases. In those cases, you generally need to use exporters. Exporters act as an intermediary between services and your Prometheus servers, collecting data from the services and making it available to Prometheus for scraping. Because Prometheus has a robust open source community, there are a lot of third-party exporters that help you expose data to a Prometheus server.

Many open source projects also have native Prometheus endpoints. When you use projects with native Prometheus endpoints, you don’t need an exporter. These open source projects make it easier to integrate Prometheus without any additional work from engineers. Examples include:

  • ArgoCD, which helps manage GitOps workflows
  • CoreDNS, which is used to manage DNS for Kubernetes’ clusters
  • Istio, an open source service mesh

Time series database and multidimensional model

The Prometheus server pulls data into a time series database. Time series data includes a timestamp and optional labels stored as key-value pairs, and it’s especially useful for tracking how data changes over time.

While other database systems such as Cassandra, PostgreSQL, and MongoDB provide support for time series data, Prometheus is specifically designed for this kind of data. That makes Prometheus ideal for real-time monitoring.

Prometheus also uses a multidimensional model. That means you can query your data in many different ways, such as by job, endpoint, or time period. The ability to slice and analyze your data is very important for getting full observability into the systems you’re monitoring. For instance, narrowing down a query to a specific endpoint might correspond to a microservice or piece of hardware. On the other hand, querying data over a time period provides metrics for dashboards, including average response times and a high-level view of how a system is performing. Ultimately, a multidimensional model gives you tremendous flexibility in how you query and analyze your telemetry data.

Now that you know how Prometheus scrapes, pulls, and stores data, how can you actually see that data?

How can you see your Prometheus metrics?

Prometheus metrics provide valuable insight that can help you monitor your services. Prometheus comes with a flexible query language known as PromQL (short for Prometheus Query Language) that you can use to query your metrics. But where do you query your data, and how do you visualize it? There are several different options:

  • Use the built-in expression browser. Prometheus provides an expression browser that you can use to see your data. It’s easy to use but very basic.
  • Use an analytics and visualization platform. The most popular option is Grafana, which is open source and provides powerful dashboard and visualization features.
  • Use an observability platform. You can use an observability platform like New Relic, which provides dashboards and visualizations like Grafana. An observability platform also provides data storage and the ability to instrument services you aren’t monitoring with Prometheus, which platforms focused on just analytics and visualization don’t provide.
  • Combine multiple platforms. You can also combine the benefits of both kinds of platforms as well.

Let’s take a look at each option. Stating the obvious: you need to have a Prometheus server deployed and scraping at least one target before you can look at any data. If you haven’t learned how to do that yet, check out the Prometheus Getting started documentation for a tutorial that shows you how to download, run, and set up a basic configuration.

Expression browser

Once you’ve set up at least a basic Prometheus server, you can use Prometheus’s built-in expression browser at localhost:9090/graph to view your metrics. If you haven’t set up any external targets yet, you can even have Prometheus scrape itself (generally at localhost:9090). While that’s not extremely useful in itself, it’s a good way to ensure that Prometheus is up and running.

While you can make PromQL queries directly to a Prometheus server, that’s not the most effective way to see your metrics in action. Prometheus doesn’t offer features like distributed tracing, real user monitoring, and application performance monitoring, and its dashboards aren’t very fancy. You’ll likely want to query and visualize your data somewhere else.

Grafana

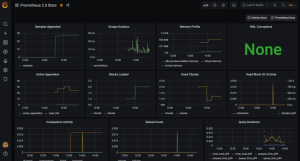
Grafana is open source analytics and visualization software that you can use to query your Prometheus data. Note that Grafana does not store your Prometheus data. Grafana’s only job is to query and visualize, and it does both very well. Here’s an example of a Grafana dashboard visualizing Prometheus metrics.

If you want to build dashboards with your Prometheus data in Grafana, you just need to add Prometheus as a data source and then create a Prometheus graph.

Observability platform

An observability platform like New Relic gives you additional options for scaling and storing your data. New Relic provides up to 13 months of storage for your data and is compatible with PromQL.

To store Prometheus data in New Relic, you can set up the remote write integration or use the Prometheus OpenMetrics integration for Kubernetes or Docker. The steps for setting up the remote write integration are included in Harnessing the power of open source metrics in New Relic. You can also read the documentation to learn more about both integration options.

Combining multiple platforms

Fortunately, you don’t need to choose between the benefits of Grafana and the benefits of an observability platform. Grafana is so popular and useful that many observability platforms include integrations so you can use both. With New Relic, you can use New Relic’s Prometheus remote write integration to combine Grafana with both Prometheus and New Relic. With the remote write integration, New Relic ingests Prometheus metrics, then passes that data on to Grafana. You get the enhanced scalability and features of New Relic along with Grafana’s dashboards. New Relic also offers a Prometheus OpenMetrics integration that allows you to scrape data from Prometheus endpoints and send it to New Relic.

We recommend trying both Grafana and New Relic. There are advantages to both platforms, and you can benefit from using them together.

If you want to evaluate New Relic state of the art observability platform, sign up for a New Relic account today.


APM vs. Observability

APM provides users with dashboards and alerts to troubleshoot an application’s performance in production. These insights are based on known, or expected, system failures—typically related to SRE golden signals—and provide engineers with alerts when pre-defined issues arise, with breadcrumbs and recommendations on how to troubleshoot.

But what about issues that arise that weren’t predefined or expected? Today’s software environments are increasingly distributed, with software that is built, deployed, and maintained by distributed teams. This software also runs on a wide array of hosts—whether on premises or in the cloud. It’s critical for teams to conceptualize, troubleshoot, and improve these distributed systems. An observability practice gives teams the flexibility to query the “unknown unknowns” in their dynamic systems and investigate and troubleshoot anomalies as they arise. Observability platforms give teams a connected, real-time view of their operational data in one place, so they can better understand system behavior to make iterative improvements to the entire stack.


You need application performance monitoring.

IT teams typically adopt APM as a best practice to understand and improve system performance, by helping them identify when an application is slow or broken and then fix issues before they affect users. Through pre-configured alerts and visualizations, APM helps teams understand metrics like response time, throughput, and errors.

You can monitor the performance of everything from websites, to mobile apps, servers, networks, APIs, cloud-based services, and other technologies with tools, products, and solutions including:

  • operational dashboards
  • real user monitoring
  • mobile monitoring
  • synthetic monitoring
  • serverless monitoring
  • database monitoring
  • infrastructure monitoring
  • service maps

APM provides a high-level view of how an application is performing and works well for the questions or conditions you know to ask in advance, such as:

  • “What’s my application’s throughput?”
  • “Alert me when I exceed a certain error budget.”
  • “What does compute capacity look like?”

But many modern application architectures are too complex to monitor and manage with just APM. You need to consider multiple data sources and various telemetry data types (not just metrics). You also need to think about logging. Each run time is likely emitting logs in different places, and you need a way to consolidate that data and evaluate it in the context of your application. And, as you add more services and microservices components to your architecture, when a user accesses one of these services and gets an error, you need to be able to trace that request across multiple services. You also need to be able to investigate all of this data in one place, so you don’t lose context and can improve KPIs like mean time to recovery (MTTR).

To get to the root cause of an issue when you have multiple run times and many architecture layers, it’s necessary to take a more holistic, proactive approach. While APM provides aggregated metrics, you also need other insights to understand your dynamic stack


You really need observability.

Observability is about getting deep, technical insights into the state of your entire system, no matter how large or complex it is. It helps DevOps teams navigate the challenges of increased fragmentation in today’s distributed systems. Observability also gives you the power to understand patterns and connections in your data that you hadn’t previously considered.

Observability platforms automate collecting data from an array of  sources and services together in one place, help you monitor the health of your application by visualizing its performance in context of the entire stack, and then give you the insights to take action. These insights help you understand not just that something happened, but why, with all the tools at your fingertips to take action to resolve.

When evaluating observability platforms, look for ones that allow you to:

APM is part of your observability practice.

Given the application-centricity of today’s software stacks, you can’t have observability without a strong APM discipline.

You can think of it this way: Observability (a noun) is the approach to how well you can understand your complex system. Application performance monitoring (a verb) is an action you take to help in that approach. Observability doesn’t eliminate the need for APM. APM just becomes one of the techniques used to achieve observability.

If you want to evaluate New Relic state of the art observability platform, sign up for a New Relic account today.


Agent vs. Agentless Architectures in Access Management

Agent-based Access Management: Welcome to the World of Agent++

One of the biggest challenges with using agents for Access Management is they inherently require a 1:1 ratio of agent to infrastructure. In an Access Management context, that means you must have an agent on every piece of infrastructure if you hope to streamline access across your environment. We call this Agent++.

What is Agent++?

Agent++ is the continuous act of adding agents to every piece of infrastructure to provide streamlined access, due to the need to have a 1:1 ratio of agents to systems. That means:

  • You need an agent installed on every existing system.
  • You need an agent installed on every new system.
  • You need to update every agent on every system over time.

The result is an endless loop: New system. New agent. New system. New agent. Found an old system? New agent.

In Access Management, “Agent++” means you’ve suddenly traded managing access at a system-by-system level to managing agents on a system-by-system level. Sure, you may have gained some efficiencies, but you’ve also introduced a slew of new challenges.

Agents, Overhead and their Impact on Efficiency

When the implementation process for a tool is complicated and time-consuming, that doesn’t bode well for you over time. This is where most people begin to recognize the issues with an agent-based approach to access management, because once you’ve taken inventory of all of your systems, you now have to install agents on every system.

And that’s just the starting point. The challenges associated with an agent-based approach to Access Management will compound over time. For example:

  • Due to the agent-based need to be on every single system, the initial implementation may be a lengthy process, delaying your team’s ability to quickly and easily access infrastructure.
  • Onboarding new systems will require individual agents to be installed on every one, every time.
  • Since agents share resources with the systems they’re installed on, they compete for resources with your critical systems.
  • You’ll eventually need to upgrade every agent over time – a process that will only become more complicated and time-consuming with every new system you add.

Relying on agents will dramatically impact the efficiency and productivity of your development and security teams – and not in a good way.

Access Management: Agents vs. Agentless

Access Management is inherently an additive process. Access must be provided and managed for new, existing, and shadow (assuming you find them) systems in your infrastructure. That means that the ability to easily onboard and manage systems is critical.

Agent-based architectures are detrimental to this goal in a few key ways:

  • There is an inability to dynamically add systems with minimal delay and overhead.
  • Resources are required to manage agents over time.
  • There is higher development overhead.

Conversely, agentless architectures do not have many of those issues. By going agentless, it becomes significantly easier to add and remove new systems, there is no resource conflict between infrastructure and agents, and you no longer have to be concerned with managing or updating agents on every single system in your infrastructure.

The combination of agentless benefits ultimately means less overhead, less impact on efficiencies over time, and now you no longer need to worry about Agent++.

Agent++ in the Wild: One company’s struggle with agents, upgrades, and access

One StrongDM customer in the software development space had this exact issue – the company was using a tool that required agents to be installed on every new system. But because the company was growing rapidly, managing the scale and complexity of the deployment quickly became overwhelming, with one team lead stating, “You’d think a company full of really good engineers could get the solution deployed quickly – but it turned out to really be a burden.”

The organization struggled to keep up with the agents as new systems were added, when new people would join with new machines, and also when it came time to upgrade. “Every time we upgrade, there’s a huge project just to upgrade everything at the same time. We end up having to limp along.” And that was only working with three infrastructure tools, much less delivering streamlined access across the entire environment. This burden drove the company to explore other access solutions, including StrongDM (which they ultimately chose).

Want to see how agentless access management can help your organization? Book a demo of StrongDM.


About the Author

Dominic Garcia, Senior Marketing Director, has held marketing leadership roles for Silicon Valley technology companies specializing in database, data management, and data analytics solutions. As head of content marketing at Splunk, Dominic contributed to boosting the company’s market visibility and its growth from a $100M to a $1.3B company. He brings relentless creativity to the task of connecting people with technical products to improve their lives. Dominic holds a B.S. degree in Public Relations from the University of Texas at Austin.

Monitor GitLab with OpenTelemetry and New Relic

With this integration, you can shift left and get observability for the build and deploy phases of the DevOps lifecycle.

How the integration works

The New Relic GitLab integration is split into two parts for ease of use. Both parts run as jobs in your existing or new GitLab pipelines. You’ll learn how to integrate each part in the next section.

  • New Relic exporter: Add this job to the end of each of your pipelines to export your pipeline data as logs and traces to New Relic. You’ll be able to use the distributed trace viewer to inspect each pipeline run as well as explorer logs in the log explorer.
  • New Relic metrics exporter: This job should be scheduled. It exports GitLab data for all your projects, pipelines, jobs, runners, environments, deployment, and releases. You can configure which groups and projects are included. You can also run this as a standalone container outside GitLab.

Let’s look at some examples that show what you can visualize in New Relic after you’ve enabled the integration.

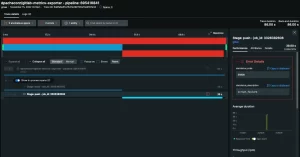
The following distributed trace captured by the New Relic exporter shows a job that contains an error with associated logs in context.

The next two images show metrics captured by the New Relic metrics exporter. The following image shows the latest pipeline duration with the configured attributes as dimensions.

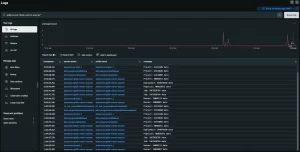
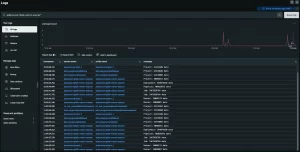
The next image shows GitLab resources as log events with the configured attributes.

Configuring the exporters

Both exporter integrations are set up similarly, but with one key difference:

  • The New Relic exporter needs to be set up for each pipeline you want to report data for.
  • The New Relic metrics exporter only needs to be set up once.

Prerequisites:

Before setting up the integration, you will need both a GitLab token and a New Relic ingest API key.

  1. Follow these steps in the API documentation to generate a New Relic ingest API key.
  2. Generate a GitLab API Token with “read_api” access.
    • In the top-right corner, select your avatar.
    • Select Edit profile.
    • On the left sidebar, select Access Tokens.
    • Enter a name and optional expiration date for the token.
    • Select the “read_api” scope.
    • Select Create personal access token.


Setting up the New Relic exporter

The New Relic exporter should be configured to run as a child job at the end of your project pipeline. It will ship the data from the pipeline to New Relic as a distributed trace with the logs being reported as logs in context.

Step one: Create CI/CD variables in GitLab

First, you need to set up your CI/CD variables in GitLab.  In addition to the required GitLab token and New Relic API key, there are also several optional variables.

To add or update variables in GitLab for your project:

  1. Go to your project’s Settings > CI/CD and expand the Variables section.
  2. Select Add variable and fill in the details for the following required variables. Make sure that both variables are masked.
    1. GLAB_TOKEN provides access to the GitLab API. Add the GitLab API token you created in the previous section.
    2. NEW_RELIC_API_KEY is the ingest API key you created in the previous section.
  3. You can also update the following optional variables. Each configuration option should be set up in GitLab as a pipeline environment variable. By default, these optional variables are already set to automatically export job logs to New Relic.
    1. OTEL_EXPORTER_OTEL_ENDPOINT is the New Relic OTEL endpoint and includes a port. By default, it’s set to https://otlp.nr-data.net:4318 in the US and https://otlp.eu01.nr-data.net:4318 in the EU.
    2. GLAB_EXPORT_LOGS is used to export job logs to New Relic. This variable is a boolean that’s set to true by default.
  4. GLAB_ENDPOINT is the GitLab API endpoint. It’s set to https://gitlab.com by default.

Step two: Add the pipeline configuration for the exporter

  • Create a file called new-relic-exporter.yaml in the root directory of the GitLab project, repository, or branch you want to monitor.

Add the following pipeline code. The New Relic image is provided for testing purposes. It’s recommended that you use your own image of the exporter in production. You can build your own image based on the repository.

stages:
- new-relic-exporter
new-relic-exporter:
 rules:
   - when: always
 image:
   name: docker.io/dpacheconr/gitlab-exporter:1.0.0
 stage: new-relic-exporter
 script:
   - echo "Done"

Ensure that the rule is set to always so that the exporter runs even if previous jobs fail.

Step three: Add the exporter job to your existing pipeline

In your .gitlab-ci.yml  file, add a new stage with the name new-relic-exporter to your stages block as shown in the next code snippet. This should be set as the last stage in the list.

stages:
…existing stages…
- new-relic-exporter

Configure the new-relic-exporter stage block as shown in the next code snippet:

new-relic-exporter:
 stage: new-relic-exporter
 inherit:
   variables: true
 variables:
   CI_PARENT_PIPELINE: $CI_PIPELINE_ID
 trigger:
   include:
     - local: new-relic-exporter.yml


Step four: Test and confirm that New Relic is receiving data

Commit your code to run your pipeline and confirm that the New Relic Exporter job runs as the final job in the pipeline.

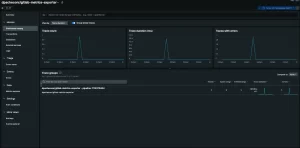
Log into New Relic, go to Services – OpenTelemetry, and select the entity. It will have the same name as the project, repo, or branch that you are monitoring. Select the Distributed Traces tab and confirm that you can see a trace for your pipeline. Sometimes it takes a few minutes for the first trace to appear. The next image shows an example of a trace from the exporter.

Next, go to the Logs tab and confirm that you can see your pipeline logs appearing.

If there is no data, ensure that you have correctly set up the environment variables with the appropriate keys. In GitLab, you can check the New Relic exporter job output for additional debugging information.


Setting up the New Relic metrics exporter

The New Relic metrics exporter is standalone and does not need to be attached to an existing project pipeline. You should run it in its own project pipeline, but you can add it to an existing pipeline if you prefer.

This gathers data from the GitLab API about your projects, pipelines, jobs, runners, environments, deployments, and releases, then exports the data to New Relic as a mixture of metrics and logs.

To get the latest data from your accounts, you should run the New Relic metrics exporter on a regular basis. At least once per hour is recommended.

Step one: Create a new project

Create a new GitLab project and give it a descriptive name like New Relic metrics exporter.

Step two: Create CI/CD variables in GitLab

The exporter job has a number of configurable options which are provided as CI/CD environment variables. You must supply a GitLab token and New Relic API key.

You also need to provide a regular expression to define which projects and groups you’d like the exporter to monitor. Your GitLab token may have access to data you don’t want to export so take care to set this up so that only the projects and groups you are interested in are captured.

The other configurations are optional. Each configuration option should be set up as a pipeline environment variable. See the README for a list of the configuration options available along with their default values. The defaults with no additional configuration will run the job every 60 minutes.

To add or update variables in project settings:

  1. Go to your project’s Settings > CI/CD and expand the Variables section.
  2. Select Add variable and add your GLAB_TOKEN and NEW_RELIC_API_KEY. Don’t forget to mask both variables.
  3. Add or update any optional variables as needed for your project. If you want to change the frequency of the job to a value other than 60 minutes, you can do so with the optional variable GLAB_EXPORT_LAST_MINUTES.

Step three:   Create your pipeline definition

If you have created a new project for this exporter as recommended, you will need to create the pipeline definition file .gitlab-ci.yml in the root of your project. Add the pipeline code shown in the next snippet.

stages:
- new-relic-metrics-exporter
 new-relic-metrics-exporter:
 rules:
   - when: always
 image:
   name: docker.io/dpacheconr/gitlab-metrics-exporter:1.0.0
   pull_policy: always
 stage: new-relic-metrics-exporter
 script:
   - echo "Done"

Step four: Test the pipeline

Run the pipeline and confirm that the New Relic metrics exporter job runs correctly with no errors, by checking the New Relic metrics exporter job output.

To execute a pipeline schedule manually, follow these steps in GitLab:

  1. On the top bar, select Main menu > Projects and find your project.
  2. On the left sidebar, select CI/CD > Schedules.
  3. Select Play to run the desired pipeline.

In the New Relic query builder, run the following NRQL query to ensure that New Relic is receiving data from the exporter:

SELECT * FROM Log where gitlab.source ='gitlab-metrics-exporter'

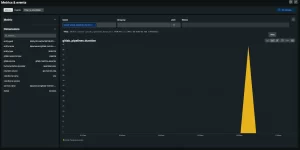
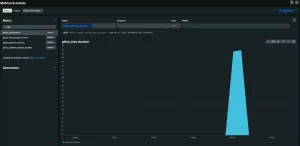
Go to Metrics & Events in New Relic and your GitLab metrics in the list of available metrics. These metrics will be prefixed with gitlab. Metrics include pipeline, job duration, and queue duration. The next image shows the information on the duration of GitLab jobs.

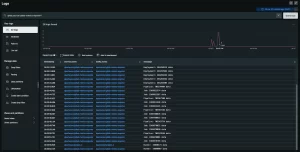
Go to Logs in New Relic to see your log events. Apply the filter gitlab.source:"gitlab-metrics-exporter" to only see data sourced from new-relic-metrics-exporter. You will be able to see log data on all of your GitLab resources, including your projects, deployments, and runners.

Step five: Create a pipeline schedule

Once you have confirmed the job is correctly sending data, you need to set up a schedule in GitLab to run the job regularly. The schedule pattern should match the value from GLAB_EXPORT_LAST_MINUTES. As discussed earlier in this post, the default is 60 minutes. Setting values that are different from the value in GLAB_EXPORT_LAST_MINUTES can lead to duplicate or missing data in New Relic.

To add a pipeline schedule, do the following in GitLab:

On the top bar, select Main menu > Projects and find your project.

On the left sidebar, select CI/CD > Schedules.

Select New schedule and add an interval pattern To run hourly, set the pattern to  0 * * * *.

Step six: Import the quickstart dashboard

We’ve built a starter dashboard to visualize your GitLab data and help you monitor your jobs and pipelines. You can install this dashboard using the GitLab quickstart and then further customize it as needed. To get this dashboard, simply follow these steps:

  1. Go to the Gitlab quickstart in New Relic Instant Observability and select Install now.
  2. Choose an account and select Begin installation.
  3. If you’ve already completed the earlier steps in this tutorial, select Done to move on to the next step.
  4. The quickstart deploys the resources to your account. Select See your data to get to the dashboard.

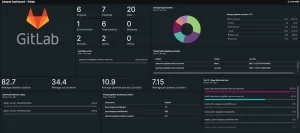
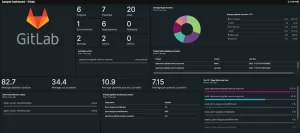
The following image shows the dashboard, which provides a summary of key metrics such as the number of runners available, the number of successful jobs, the top errors, and the job queue status.

Conclusion

After you’re done, you’ll have complete visibility into your GitLab estate, from high-level metrics to logs and distributed traces. The next step is to consider adding alerts when certain thresholds are met, such as when jobs are taking too long, or when the number pipeline failures gets too high.

By sending your GitLab data to New Relic, you get observability into the building and deployment phases of the DevOps lifecycle, providing you with more insights into your DevOps practices and helping you shift left.

If you want to evaluate New Relic state of the art observability platform, sign up for a New Relic account today.

___________________________________________________________________
Diogo Daniel Pacheco is a Senior Solutions Architect at New Relic, where his focus is creating imaginative solutions and solving difficult problems and providing observability to New Relic customers. He is a keen learner of new technologies and relishes a challenge. Diogo is a big enthusiast of Kubernetes and containerization.

StrongDM Moves to the Leader Quadrant for IAM and PAM

Last year, we boasted six badges. But as we close out 2022, we’re the proud holders of 14 badges, and we’re honored that our users have ranked us so highly. Not only did we double our badges, but we also moved into the Leader Quadrant for both the Identity and Access Management (IAM) Grid Report and the Privilege Access Management (PAM) Grid report.

Badges are earned based on review ratings from our customers. Here’s what we’re seeing on our virtual sash this winter, thanks to our users:

  • Leader in Privileged Access Management (PAM)
  • Leader in Identity Access Management (IAM)
  • Fastest Implementation
  • Easiest Admin
  • Users Most Likely to Recommend
  • Best Support
  • Easiest Setup
  • Easiest to Do Business With
  • Best Estimated ROI

These badges join our previous honors, including Highest User Adoption and High Performer and Easiest Admin. We’ve snagged Best Support for multiple quarters, and as one user said:

“Their support is the best I’ve ever worked with. I always tell everyone the same thing…if something is wrong, there will be 4 StrongDM engineers on a zoom call with you within 5 minutes to help troubleshoot. …I truly have nothing bad to say about StrongDM.”

Find out for yourself why we surged to become a leader in IAM and PAM. Contact us today and Book a demo of StrongDM.


About the Author

StrongDM Team, People-First Access platform, StrongDM, gives technical staff access to the infrastructure they need to be productive.


LDAP vs. Active Directory: Everything You Need to Know

What Is LDAP and Active Directory?

Lightweight Directory Access Protocol (LDAP) and Active Directory (AD) are core to Identity and Access Management (IAM). Both are legacy methods that have been in use since the mid-1990s. And both continue to be popular today. While AD and LDAP mean two distinctly different things, some people use these terms interchangeably.

Lightweight Directory Access Protocol (LDAP)

So, what is LDAP? Lightweight Directory Access Protocol is an open, platform-independent protocol used to access and maintain directory services over a TCP/IP network. It’s considered lightweight because LDAP is a pared-down version of an older X.500 network directory services standard called Directory Access Protocol (DAP).

LDAP provides a framework for organizing data within a directory. It also standardizes how users, devices, and clients communicate with a directory server. Because LDAP is optimized for speed, it excels at searching through massive volumes of data quickly. LDAP’s scalability makes it an ideal solution for large enterprises that need to authenticate users on platforms with thousands—or even millions—of users.

Active Directory (AD)

Active Directory (AD) is Microsoft’s proprietary directory service for Windows domain networks. It comprises a database (called a directory) and various services, all of which work together to authenticate and authorize users. The directory contains data that identifies users—for example, their names, phone numbers, and login credentials. It also contains information about devices and other network assets.

AD simplifies IAM by storing information about users, devices, and other resources in a central location. Organizations can enable single sign-on (SSO) to allow users to access multiple resources within a domain using one set of login credentials. AD checks to ensure that users are who they claim to be (authentication) and grants access to resources based on each individual user’s permissions (authorization).

LDAP vs. Active Directory: What’s the Difference?

The difference between LDAP and Active Directory is that LDAP is a standard application protocol, while AD is a proprietary product. LDAP is an interface for communicating with directory services, such as AD. In contrast, AD provides a database and services for identity and access management (IAM).

LDAP communicates with directories using a LDAP server. Some organizations use LDAP servers to store identity data for authenticating users to an application. Because AD is also used to store identity data, people sometimes confuse the two methods or conflate them as “LDAP Active Directory” or “Active Directory LDAP.” The fact that AD and LDAP work together adds to the confusion that leads people to think of Active Directory as LDAP.

Similarities Between LDAP and Active Directory

Active Directory is a Microsoft application that stores information about users and devices in a centralized, hierarchical database. AD provides a powerful identity and access management solution. Enterprises use AD to authenticate users to access on-prem resources with a single set of login credentials.

Applications typically use the LDAP protocol to query and communicate with directory services. However, when it’s used in combination with Active Directory, LDAP can also perform authentication. It does this by binding to the database. During binding, the LDAP server authenticates a user and grants access to resources based‌ on that user’s privileges.

While Microsoft uses the more advanced Kerberos protocol as its default authentication method, AD offers organizations the option to implement LDAP instead. LDAP provides a fast and easy method of authentication. It simply verifies the user’s login credentials against the information stored in the AD database. If they match, LDAP grants the user access.

LDAP and Active Directory Advantages and Disadvantages

LDAP and Active Directory have their respective strengths and weaknesses. Evaluating the pros and cons of LDAP vs. Active Directory can help organizations gain a clearer understanding of LDAP vs. AD.

Advantages

These are the main benefits of using LDAP:

  • It is widely supported across many industries.
  • It is a standardized, ratified protocol.
  • It is available as open-source software and has a very flexible architecture.
  • It is lightweight, fast, and highly scalable.

Active Directory also offers many benefits, including

  • It is highly customizable, making it easy to use, manage, and control access.
  • It leverages trust tiers and extensive group policies to provide stronger security than other directory services.
  • It includes compliance management features, such as data encryption and auditing.
  • Different versions exist for different needs, including federation services and cloud security.

Disadvantages

As a legacy technology, LDAP has a few downsides. Organizations can find these challenges difficult to overcome:

  • Its age: LDAP was developed during the early days of the internet.
  • It is not well-suited for cloud and web-based applications.
  • Setup and maintenance can be very challenging and usually require an expert.

Active Directory has several drawbacks, too. Here are some disadvantages to consider:

  • It only runs in Windows environments.
  • Because AD manages the network, the entire network will go down if AD fails.
  • Setup and maintenance costs can be high.
  • Legacy AD is limiting because it requires on-prem infrastructure.

LDAP and Active Directory Use Cases

So, is there a difference between AD and LDAP when it comes to use cases? Yes, indeed.

LDAP was originally developed for Linux and UNIX environments, but today it works with a wide range of applications and operating systems. Examples of popular applications that support LDAP authentication include OpenVPN, Docker, Jenkins, and Kubernetes. One of the most common use cases for LDAP is as a tool for querying, maintaining, and authenticating access to Active Directory.

In contrast, Active Directory is less flexible than LDAP because it only operates in Microsoft environments. AD excels at managing Windows clients and servers and works well with other Microsoft products, such as SharePoint and Exchange. Because AD and domain-joined Windows devices are tightly integrated, Active Directory is more secure than LDAP.

LDAP or Active Directory–Which One Should You Choose?

LDAP’s speed and scalability make it the better option for large applications that need to authenticate vast numbers of users. Examples of organizations that might benefit from LDAP include companies in the airline industry or wireless telecommunications providers that handle millions of subscriber queries.

Microsoft Active Directory is the most widely used directory service for enterprises. It is a good solution for highly structured organizations, such as large commercial banks and government agencies, which prioritize security and compliance. The typical AD customer relies primarily on Windows-based architecture instead of using cloud-, web-, or Linux-based applications.

Because AD was designed for a traditional, on-prem environment with a clearly defined perimeter, there’s no simple way to move it to the cloud. Likewise, because of its age and on-prem limitations, legacy LDAP isn’t a good option for cloud or hybrid environments, either.

How StrongDM Can Help with LDAP and Active Directory

Both LDAP and Active Directory require an identity provider to enable SSO authentication. This makes it important to choose a flexible infrastructure access platform (IAP) that verifies authentication and uses identity based authorization with. integration capabilities.

With StrongDM, you can manage identity data and control privileged access to business-critical network resources using AD or another directory service. StrongDM supports all standard protocols, including LDAP. This makes it easy to provide frictionless, secure access to applications, databases, and other network resources.

In addition, StrongDM provides deep visibility into user activity, allowing security teams to monitor the entire network in real time. IT administrators can onboard or offboard users, leverage granular controls to manage access, and perform system auditing—all from a single control plane.

Simplify and Strengthen Access Management with StrongDM

As you have seen, there’s a big difference between LDAP and Active Directory. Both have unique use cases. Regardless of whether you use Active Directory vs. LDAP separately or together, both approaches can provide secure authorization and authentication.

StrongDM’s platform is compatible with LDAP, AD, and other popular access management methods. That makes StrongDM a smart choice for enterprises that require reliable connectivity, extensive visibility, and secure access management.

Want to see how StrongDM can streamline user provisioning? Book a demo of StrongDM today.

About the Author

Schuyler Brown, Co-founder / CCO, began working with startups as one of the first employees at Cross Commerce Media. Since then, he has worked at the venture capital firms DFJ Gotham and High Peaks Venture Partners. He is also the host of Founders@Fail and author of Inc.com’s “Failing Forward” column, where he interviews veteran entrepreneurs about the bumps, bruises, and reality of life in the startup trenches. His leadership philosophy: be humble enough to realize you don’t know everything and curious enough to want to learn more. He holds a B.A. and M.B.A. from Columbia University.


Webiscope is now part of Aman Group

We are happy to announce that Webiscope is now part of Aman Group. We look forward giving our customers and partners greater value with more complete solutions and outstanding service.