Observe every trace so you can find and fix issues fast
New Relic distributed tracing is included for APM customers
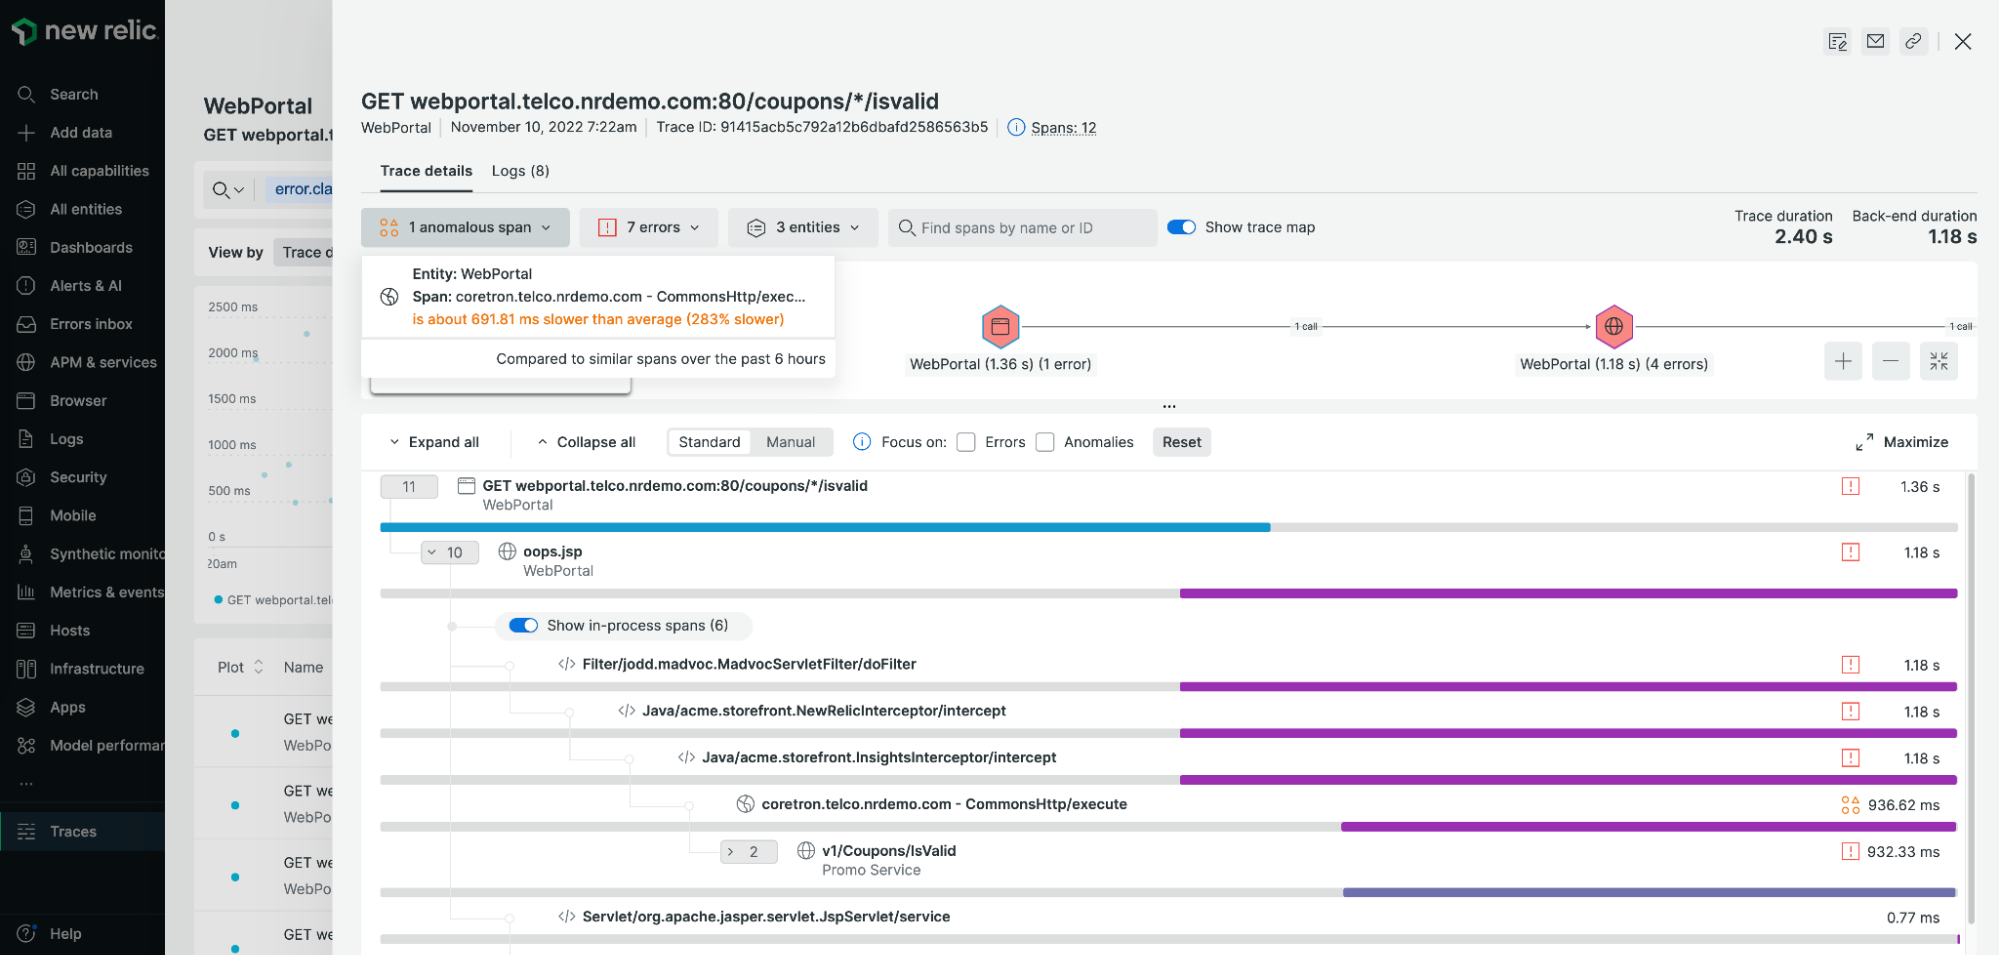
New Relic distributed tracing is designed to give software teams working in modern environments an easy way to capture, visualize, and analyze traces through complex architectures. And if you’re already using New Relic application performance monitoring (APM), you get distributed tracing at no extra charge. You just need to update your agents, open New Relic, and select Traces to see your trace data.
New Relic APM agents completely remove the operational burden of managing complex tracing software, so engineers like Andrew at Dealer.com are free to instrument their environments to generate unlimited trace telemetry without worrying about the complexities associated with deploying and scaling components.
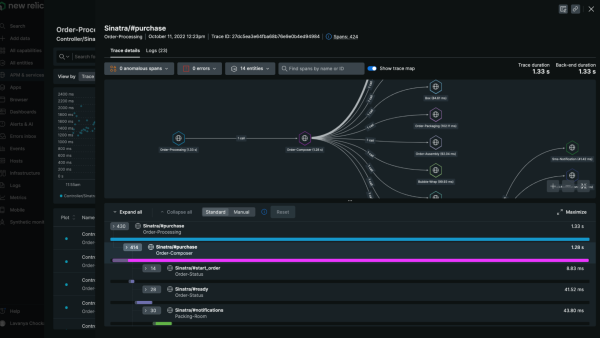
You can observe all application traces across your distributed systems automatically. New Relic distributed tracing provides actionable detailed scatter chart and waterfall visualizations for a variety of language frameworks like C, Go, Java, .NET, Node.js, PHP, Python, Ruby and more. It also includes New Relic browser data and mobile monitoring, AWS Lambda, and Zipkin format traces through the Trace API and supports common standards for traces like OpenTelemetry and W3C, so you can investigate and solve issues faster.
Understanding software complexity
To understand why distributed tracing is so important, it’s helpful to look at the cloud platforms, containerization, and container orchestration that forward-thinking software organizations use to quickly build, scale, and operate business-critical applications.
Despite the many advantages of software architectures built on microservices and serverless, the exploding number of components and their diversity in language, operating environment, and ownership creates a huge new burden for teams trying to manage them. Teams can’t effectively work toward resolving issues in a complex system until they understand all the service dependencies and how the performance characteristics of dependent services impact their requests and transactions. To find the proverbial needle in the haystack, you need a complete view of the entire system.
Understanding how a downstream service “a few hops away” can create a critical bottleneck for a service is essential for fast problem resolution. Just as important, it also provides DevOps teams with insight on how to optimize their code. If you can’t determine when, why, and how an issue happens, small defects may continue to linger in production until a perfect storm of events aligns and the system breaks all at once. Distributed tracing provides a detailed view of individual requests so you can point out precisely what parts of the larger system are causing issues to optimize and solve issues faster.
Data vs insights
Distributed tracing provides end-to-end visibility by revealing service dependencies. You can consider it a way to record and visualize requests through complex, distributed systems. But collecting and visualizing tracing data can be labor-intensive and complex to implement, like deploying, managing, and scaling third-party gateways or satellites for data collection.
New Relic makes setting up distributed tracing easy with automatic instrumentation. Our auto-instrumenting application code uses language agents that work with hundreds of different libraries and frameworks across multiple languages. You deploy one agent, and New Relic APM instruments each service involved in the request, creates timings for operations within the service, and automatically adds important troubleshooting information to each span. You can even add custom attributes to transactions and see all your information in the trace as well, without changing anything.
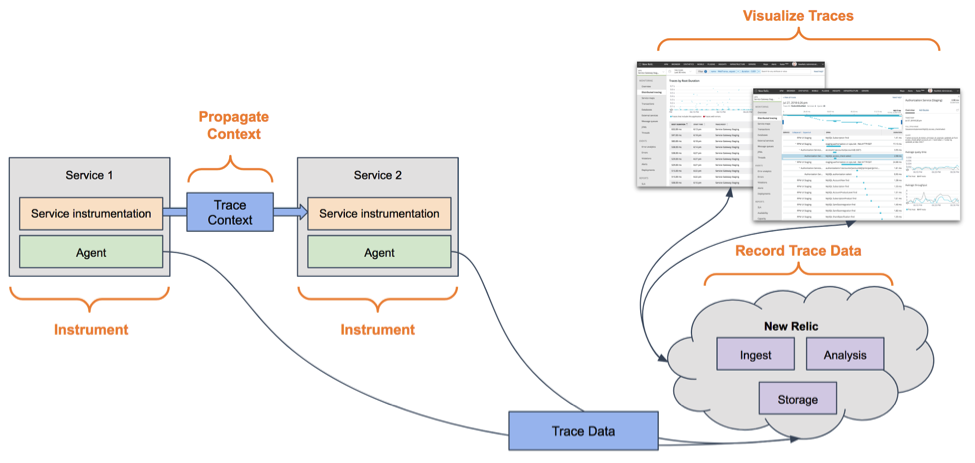
New Relic APM agents automatically create a unique trace ID for each incoming request and propagate that ID and other necessary correlation information as the “trace context” across the entire call. For example, when one service makes a call to another service, New Relic adds the trace context to the HTTP request header for the next service to use. Our auto-instrumentation is designed to eliminate the hard work of managing and propagating context.
What if you are using a transport that requires manual instrumentation? The New Relic APM agent provides an API that you can use to inject and extract the trace context. Using the W3C Trace Context format for propagating the trace context makes them interoperable with any other tracing agent or tool that also supports that standard.
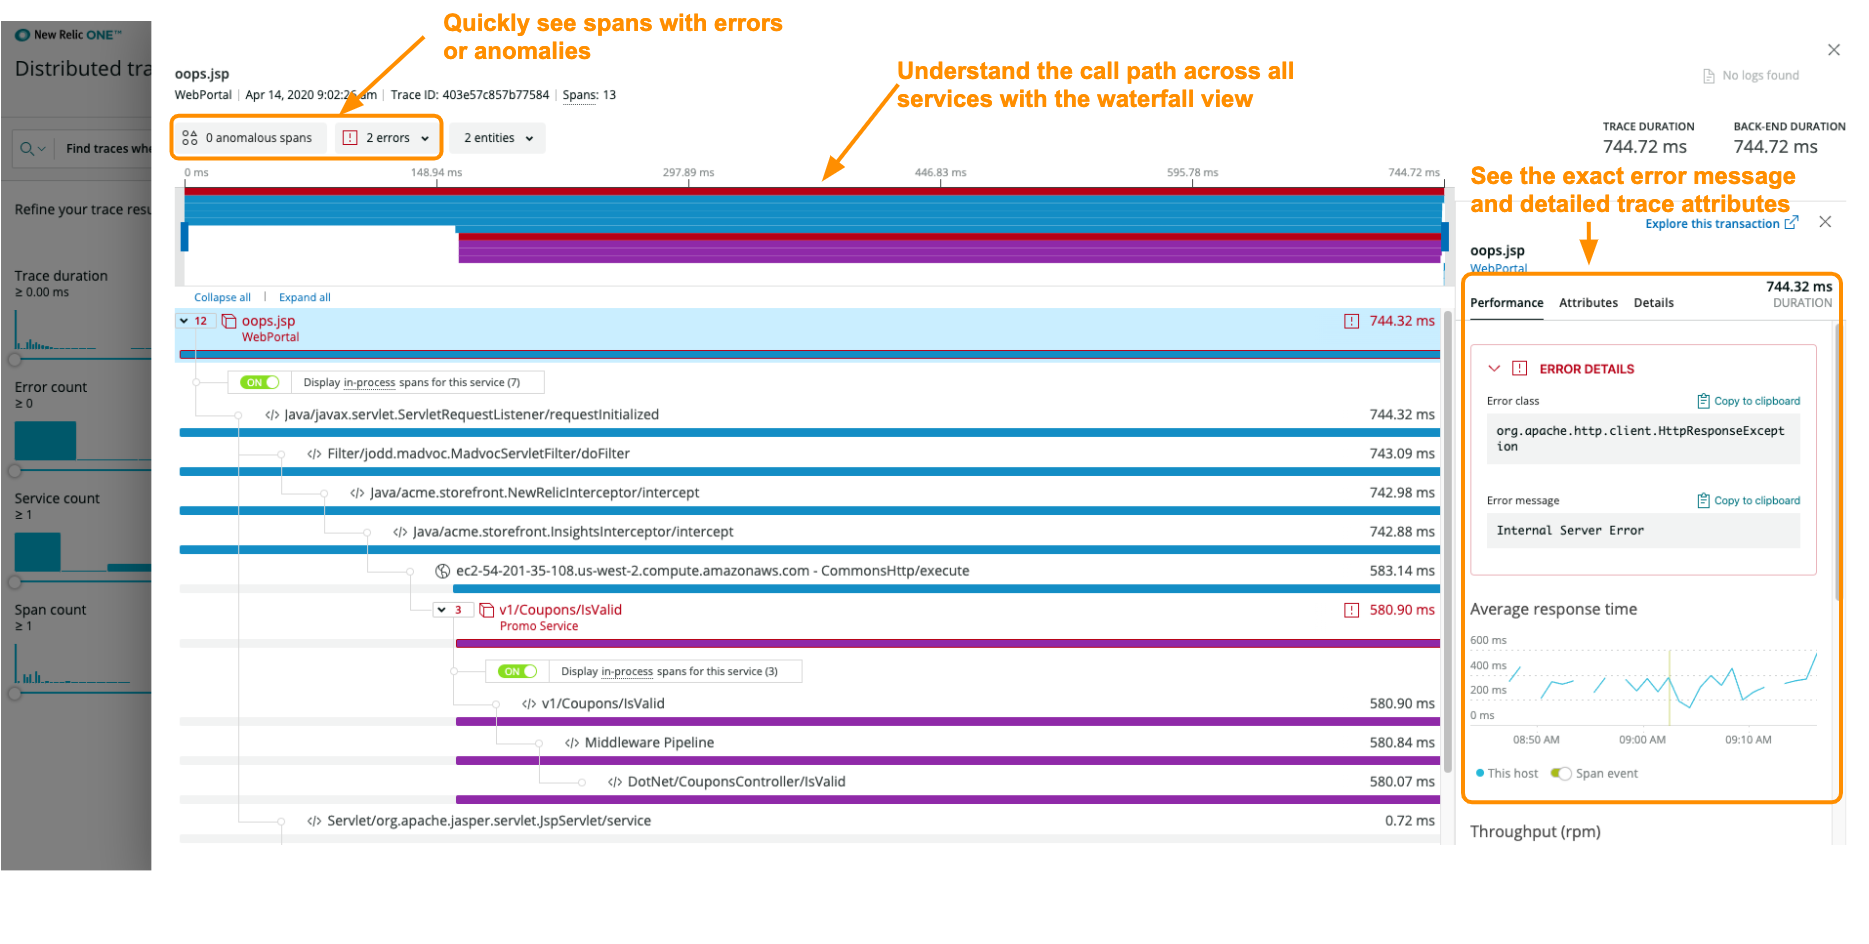
None of this matters if you can’t identify the insights in the data across your stack. New Relic APM provides trace visualizations designed to help you quickly understand why a specific request is slow, where an error originated, and where you can optimize your code to improve the experience for your customers.
Here’s a diagram that shows how these components work together for New Relic distributed tracing:
Get started with New Relic distributed tracing
Ready to get started and identify ways to improve your applications? With New Relic APM and distributed tracing, soon you’ll be analyzing complex architectures so you can better understand dependencies across your system.
1. Review the distributed tracing documentation.
2. Deploy or update to the latest APM agent to each service involved in the call path you’re interested in. Distributed tracing will be immediately available upon upgrading.
Deploy the latest Browser agent.
Deploy the latest Mobile agent.
3. That’s it! Now you can access the distributed tracing information from New Relic APM and quickly identify slow traces and traces with errors. And you can even use the advanced filtering to find traces by a combination of attributes.
The number one reason to update your agents is security. Hackers can take advantage of weaknesses in outdated software, which can lead to a wide range of issues, including theft of sensitive information, unusable files, and more. Agent upgrades often include software patches that address security vulnerabilities. If you don’t update your agents, you are putting your customers, teams, and company at risk.
2. Improve your monitoring capabilities
Agent upgrades often add new features that improve visibility into your systems and dramatically speed up the process of finding and fixing issues. Here are some benefits you get from the latest New Relic APM agents:
Decode system complexity with distributed tracing: The latest APM agents include distributed tracing automatically. With distributed tracing, you can see all your service dependencies and quickly drill down into individual requests and errors to find the root cause of issues.
Troubleshoot faster with logs in context: The latest APM agents automatically add context to logs. There’s no need to manage third-party log forwarders. Minimize context switching and troubleshoot issues faster by accessing logs inside the New Relic APM UI alongside other relevant telemetry data.
Record and monitor critical events: The latest updates allow you to define, visualize, and alert on three times more custom events than previous agents. Event data represents discrete occurrences with a high level of detail, making it well-suited for detailed analysis and making queries that are relevant to your business.
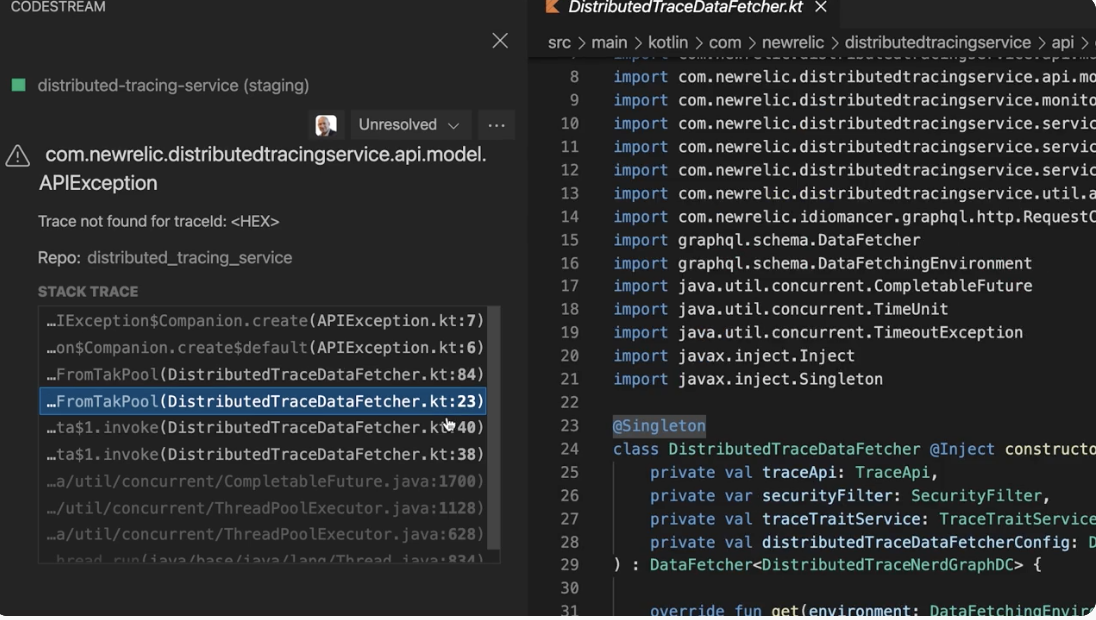
Access production telemetry data in your IDE: Our latest agents offer CodeStream support so you can see all telemetry data associated with specific lines of code. You can use CodeStream to discuss code, track issues, review pull requests, and jump from errors inbox directly to the relevant code in your IDE.
3. Access technical support and bug fixes
As older software ages out, you have fewer options for technical support. Tickets to technical support teams may take longer to resolve as a result—or there may no longer be support at all. Software teams focus on bug fixes and feature support for the latest agents, meaning that it’s harder—or sometimes even impossible—to get updates to older software. By updating to the latest agents, you’ll benefit from the bug fixes and features provided with newer versions.
Best practices for upgrading your agents
1. New Relic recommends updating to the latest agent version as soon as it’s available. If your organization has established practices that prevent you from upgrading to the latest version, you should at least ensure that your agents are regularly updated to a recent version that was released within the last 90 days.
2. Review which version of the agent you’re using to know when an update is needed. You can turn on the Agent Groundskeeper app on your account to identify which agents are using outdated versions.
3. Try to keep the same version of the New Relic agent installed on all your services. Mismatched agent versions can result in an inconsistent troubleshooting experience. For example, if some of your agents are reporting distributed trace data while others are not, you’ll have broken traces that make it more difficult to find the source of an issue across multiple services.
4. Use automation to deploy and upgrade agents. See the Update New Relic agents section in the documentation for more details.
5. Read the release notes for New Relic agents, so you can take full advantage of our latest features, enhancements, and important security patches, as well as get end-of-life announcements. You can subscribe to the RSS feed so you’re alerted when there are any changes.
How to monitor CDN performance with Akamai, Cloudflare, and Fastly integrations
CDN performance observability in minutes
We’ve partnered with leading CDN providers Akamai, Cloudflare, and Fastly to create quickstarts that bundle integration instructions, pre-built dashboards, and alerts to help you start monitoring your CDN’s performance in a matter of minutes. By integrating your CDN with New Relic, you can keep tabs on performance metrics such as load balancing, latency, availability, and other information in the context of all your telemetry data.
Akamai integration
Akamai uses its distributed cloud platform to enable users to build, run, and secure applications in one place. Akamai DataStream 2 is a real-time log delivery solution that supports sending log files to New Relic for improved log analytics.
The Akamai DataStream 2 quickstart comes with a pre-built dashboard and 5XX error alert to let you instantly monitor Akamai performance in New Relic, such as cache-hit ratio, and view client information like browser and browser version.
How to set up the Akamai integration
Watch the video above or follow the instructions below:
1. Create a job by making a POST request to the Akamai DataStream 2 endpoint.
Log in to the Akamai Control Center using an account that has access to DataStream 2.
Navigate to Common Services > DataStream > Create stream.
Configure your DataStream with a human-readable name, select desired properties, then select Next.
Choose the data sets you want to send to New Relic. Under Log format, select JSON. See Akamai’s documentation on data set parameters.
Select New Relic from the Destination drop-down menu, and configure the destination with these values:
Display name: Enter your desired description for the destination.
Endpoint: Enter the New Relic HTTP log ingest endpoint.
US: https://log-api.newrelic.com/log/v1
EU: https://log-api.eu.newrelic.com/log/v1
Auth token: Enter your New Relic API license key, which you can retrieve from the UI or API.
Sliding window aggregation: Refined control over alert monitoring
We recently introduced sliding window aggregation, a new method for alerts to aggregate metrics, smooth out visualizations, and alert on erratic or infrequent signals, including latency, traffic, errors, and saturation. This blog post shows you how to use sliding window aggregation to manage alerts more effectively.
First, let’s start with the basics: You create alert conditions in New Relic using NRQL queries. Advanced signal settings for the alert conditions give you options to better handle continuous and streaming data signals that might sometimes be missing.
We’ve expanded this functionality so you can precisely identify the source of an anomaly with minimal distractions. The window duration in the advanced signal settings for alert conditions is how the New Relic platform groups your data into intervals. A longer duration smooths out visualizations of choppy or less frequent signals, so it’s easier to spot trends in the data. You can use the new sliding window aggregation setting to gather data in overlapping time windows to smooth out the chart line.
Set your alert conditions to only find important trends, and let New Relic do the hard work of finding those trends for you. Sliding window aggregation uses faceted baseline conditions so you can:
Create smoother charts through overlapping time-series data windows that are simple to control through an intuitive slide mechanism.
Specify a time period from 1 to 120 minutes and use a NRQL query alert condition to filter the output based on average, min, max, and other values.
You control how New Relic aggregates the sliding windows in your NRQL query. For example, if you use specify average, you get the average over the sliding window.
Get started: Select your slide by interval
Want to get started with managing alerts more effectively with sliding window aggregation?
1. In one.newrelic.com, start by going to Alert conditions (Policies) under Alerts & AI to view your alerts and either edit an existing condition or set up a new condition.
2. Define your signal.
3. Set your condition thresholds.
4. Then select Fine-tune advanced signal settings > Data aggregation settings > Use sliding window aggregation to turn on sliding window aggregation, and set a slide-by interval.
Watch this video for a quick demo:
As an added benefit for more flexibility, we’ve raised the maximum window duration (the aggregation window) to 120 minutes. This increase in the maximum value is available across all NRQL alert conditions, not only sliding window aggregation.
Reminder: Build a buffer before you evaluate alerts
Keep in mind that since the alerts system only evaluates streaming data, you need to build an aggregation buffer before any violations will open on that condition. This means that if you set X as your aggregation window, for the first X minutes, no violations will trigger alerts.
As an example, imagine that you set up an alert condition using a 1-hour aggregation window and a 1-minute slide-by interval. When you save the condition, the first hour will be spent building an aggregation buffer of streamed data. No violations will trigger alerts in this first hour. After that point, the condition will behave normally. Every minute, it will have a fresh 60m of data to aggregate and evaluate.
Control data privacy with New Relic log obfuscation options
Better logs, easy security, and compliance
Our logs in context functionality extends visibility by showing logs alongside metrics to troubleshoot issues faster while including any additional filtering to follow your organization’s security guidelines to mask, obfuscate, or prevent sending any sensitive data all without the need for a lengthy manual process or custom configurations from your teams.
Here are a few examples of private data you might want to obscure:
Personally identifiable information (PII): information like Social Security numbers, combinations of data, like first name and date of birth or last name and zip code, or other user-generated data that is considered confidential.
Protected health information (PHI): Health data, such as medical records.
Financial data, like credit card numbers.
Passwords.
IP addresses may be considered sensitive, especially when in combination with PII.
Note that this is not an exhaustive list. Be sure to follow your organization’s security guidelines to see what log data you may be required to protect.
Getting started with obfuscation rules
To prevent sending PII, PHI, or any other data that needs to be secured, you can choose one of two methods:
Masking is one-way, permanent obfuscation of the data. The data will be obscured and replaced with x’s (such as XXXX, instead of your data). Once this is done, there is no way to undo it or recover the original string.
Hashing is two-way obfuscation, where the data is hidden by using a Secure Hash Algorithm 512 (SHA-256) string. A hashing tool in the UI allows customers to look up their SHA-256 by entering the original text. The user can then search for that SHA-256 string in the logs UI.
Create an obfuscation expression
Define regular expressions to specify which data to hide. Use the following options to create an obfuscation expression:
1. Go to one.newrelic.com > Logs and from the left navigation, select Obfuscation. 2. Select Create regex.
Enter a name for your new obfuscation rule and a regular expression matching the sensitive data you want to capture. Use RE2 syntax.
Create an obfuscation rule
Hide sensitive data using matching criteria:
1. Go to one.newrelic.com > Logs and from the left navigation, select Obfuscation. 2. Select Create obfuscation rule. 3. Enter a name for your new obfuscation rule and matching criteria (in NRQL format) to capture the target set of logs you want to obfuscate. 4. Add new actions (the first one is added automatically) to specify the obfuscation expression (regex) to capture each set of attributes and whether to mask or hash them. Multiple attributes can be specified comma-separated. Mask will replace all matching characters with the letter x. If you use mask, you won’t be able to query for a particular obfuscated value later. Hash will replace sensitive data with the SHA-256 hash value. If you use hash, you will be able to query them using our hashing tool, provided you know its unhashed value. 5. Select Create rule to create and activate your obfuscation rule.
You’ve now successfully created a rule to match sensitive information before data is stored in NRDB.
Get started with log obfuscation
New Relic for Startups expands with Zendesk and Carta to help early-stage startups build and scale
Our collaboration with Carta and Zendesk
o further our goal, today we’re announcing our collaboration with Carta and Zendesk to provide best-in-class platforms to scale both engineering and business practices to the next generation of founders. Now, a larger ecosystem of early-stage startups will have access to the same tools used by world-class engineering organizations. By teaming up with companies like Carta and Zendesk, all builders can establish DevOps and data-driven engineering practices early, seeing a complete picture of their apps and systems in a single platform.
Eligible startups in each program, whether New Relic, Carta, or Zendesk, will be able to take advantage of all three platforms with exclusive credits, discounts, and support.
“The Carta startup program is designed to help founders scale and make software buying decisions easier,” says Marisabel Agosto, head of strategy and tech partnerships at Carta. “We’re thrilled to partner with New Relic for Startups to provide our founders with a world-class observability platform to monitor their entire technology stack.”
“We at Zendesk are excited to partner with the New Relic team,” says Adam O’Donnell, Startup Partnerships Manager at Zendesk for Startups. “We have thousands of startups that apply for our program each year, and we try to help them grow by offering deals from other great companies. We believe that New Relic will help our founders ship better software faster by monitoring and debugging their stack accurately.”
Startup benefits
With this collaboration, the New Relic observability platform is accessible to eligible fast-growing startups that are currently using Carta or Zendesk tools. In addition, companies in the New Relic for Startups program have greater access to tools and resources provided by Carta and Zendesk. Benefits for eligible startups include:
Access to the same developer tools that the world’s leading engineering organizations use to observe, analyze, and improve the performance of their software, including the New Relic observability platform, which unifies 16 monitoring tools in one.
Generous credits and discounts across the New Relic observability platform, Carta’s equity management and company-building solutions, and Zendesk’s customer service, engagement, and sales CRM solution. This enables startups to focus on building companies around big ideas while preserving burn rates.
Easier qualification across the three programs. Startups already qualified for Carta and Zendesk’s programs will likely qualify for New Relic for Startups, and startups in the New Relic for Startups program will likely qualify for programs provided by Carta and Zendesk.
Get started with New Relic for Startups via Carta or Zendesk*
To apply for New Relic for Startups, go to the Carta Startup Stack page or the Zendesk for Startups dealbook and follow these steps:
1. Log into your Carta account or Zendesk account. 2. Select the New Relic offer on the Carta Startup Stack page or the Zendesk for Startups dealbook and fill out the form to apply. 3. Approved startups will receive instructions on how to redeem the credits. 4. Invite engineers from your organization to instrument apps with our guided install. Happy monitoring!
Webiscope is now part of Aman Group
We are happy to announce that Webiscope is now part of Aman Group. We look forward giving our customers and partners greater value with more complete solutions and outstanding service.
This website uses cookies so that we can provide you with the best user experience possible. Cookie information is stored in your browser and performs functions such as recognising you when you return to our website and helping our team to understand which sections of the website you find most interesting and useful.
Strictly Necessary Cookies
Strictly Necessary Cookie should be enabled at all times so that we can save your preferences for cookie settings.
If you disable this cookie, we will not be able to save your preferences. This means that every time you visit this website you will need to enable or disable cookies again.