How to optimize Kubernetes resource configurations for cost and performance
Rightsizing your workloads with requests and limits
In an ideal world, your Kubernetes pods would use exactly the amount of resources you requested. But, in the real world, resource usage isn’t predictable. If you have a large application on a node with limited resources, the node might run out of CPU or memory and things can break. And if you’ve been working as an engineer long enough, you know that things breaking in your architecture means frantic messages in the middle of the night and lost revenue for your organization.
On the flip side, If you allocate too many resources for CPU and memory, then there is waste since those resources remain reserved for that node. When utilization is lower than the requested value, it creates slack cost. When you design and configure a tech stack, the goal is to use the lowest cost resources that still meet the technical specifications of a specific workload.
To rightsize workloads by optimizing the use of resources, it is important to know the historical usage and workload patterns of your system. With this knowledge, you can make informed cost savings decisions. For instance, let’s say your average CPU utilization is only 40% and on your highest traffic day in the last two years the CPU utilization spiked up to only 60%. Your initially provisioned level of compute is too high! A simple change in configuration can result in large savings in cost by reducing underutilized compute resources.
Applying accurate resource requests and limits to deployments can help prevent overprovisioning of extra resources which leads to underutilization and higher cluster costs, or underprovisioning of fewer resources than required, which may lead to various errors such as out of memory (OOM) events.
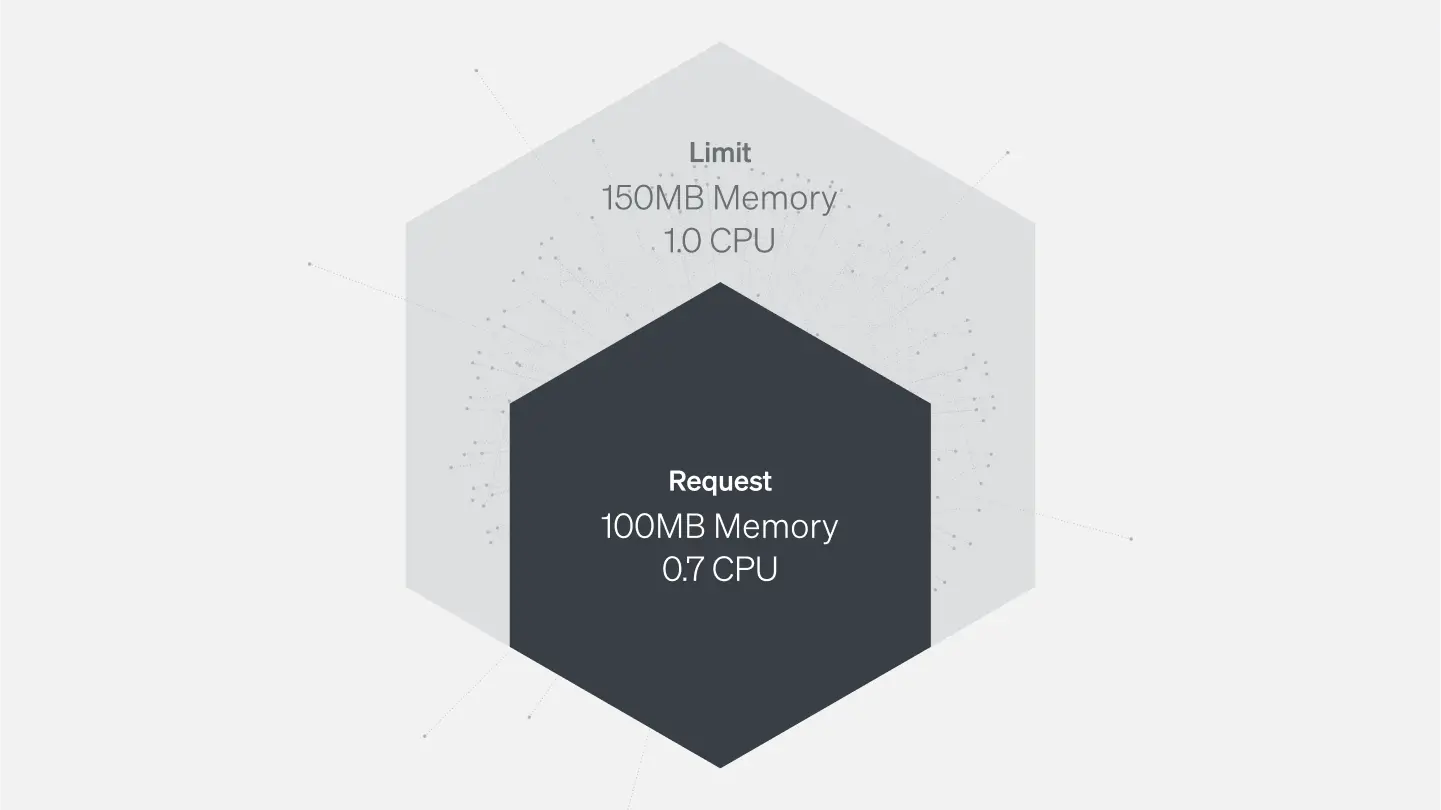
Kubernetes uses requests and limits to control resources like CPU and memory.
Requests are resources a container is guaranteed to get. If a container requests a resource, the Kubernetes scheduler (kube-scheduler) will ensure the container is placed on a node that can accommodate it.
Limits make sure a container never uses a value that is higher than its quota.
You can set requests and limits per container. Each container in the pod can have its own limit and request, but you can also set the values for limits and requests at the pod or namespace level.
Memory allocation and utilization
Memory resources are defined in bytes. You can express memory as a plain integer or a fixed-point integer with one of these suffixes: E, P, T, G, M, K, Ei, Pi, Ti, Gi, Mi, Ki. For example, the following represent approximately the same value:
128974848, 129e6, 129M, 123Mi
Memory is not a compressible resource and there is no way to throttle memory. If a container goes past its memory limit, it will be killed.
Memory limits and memory utilization per pod
When specified, a memory limit represents the maximum amount of memory a node will allocate to a container. Here are NRQL examples of querying memory limits.
NRQL that targets a New Relic metric:
SELECT latest(cpuUsedCores/cpuLimitCores) FROM K8sContainerSample FACET podName TIMESERIES SINCE 1 day ago
NRQL that targets a Prometheus metric:
SELECT rate(sum(container_cpu_usage_seconds_total), 1 SECONDS) FROM Metric SINCE 1 MINUTES AGO UNTIL NOW FACET pod TIMESERIES LIMIT 20
If a limit is not provided in the manifest and there is not an overall configured default, a pod could use the entirety of a node’s available memory. A node might be oversubscribed—the sum of the limits for all pods running on a node might be greater than that node’s total allocatable memory. This requires that the pods’ specific requests are below the limit. The node’s kubelet will reduce resource allocation to individual pods if they use more than they request so long as that allocation at least meets their requests.
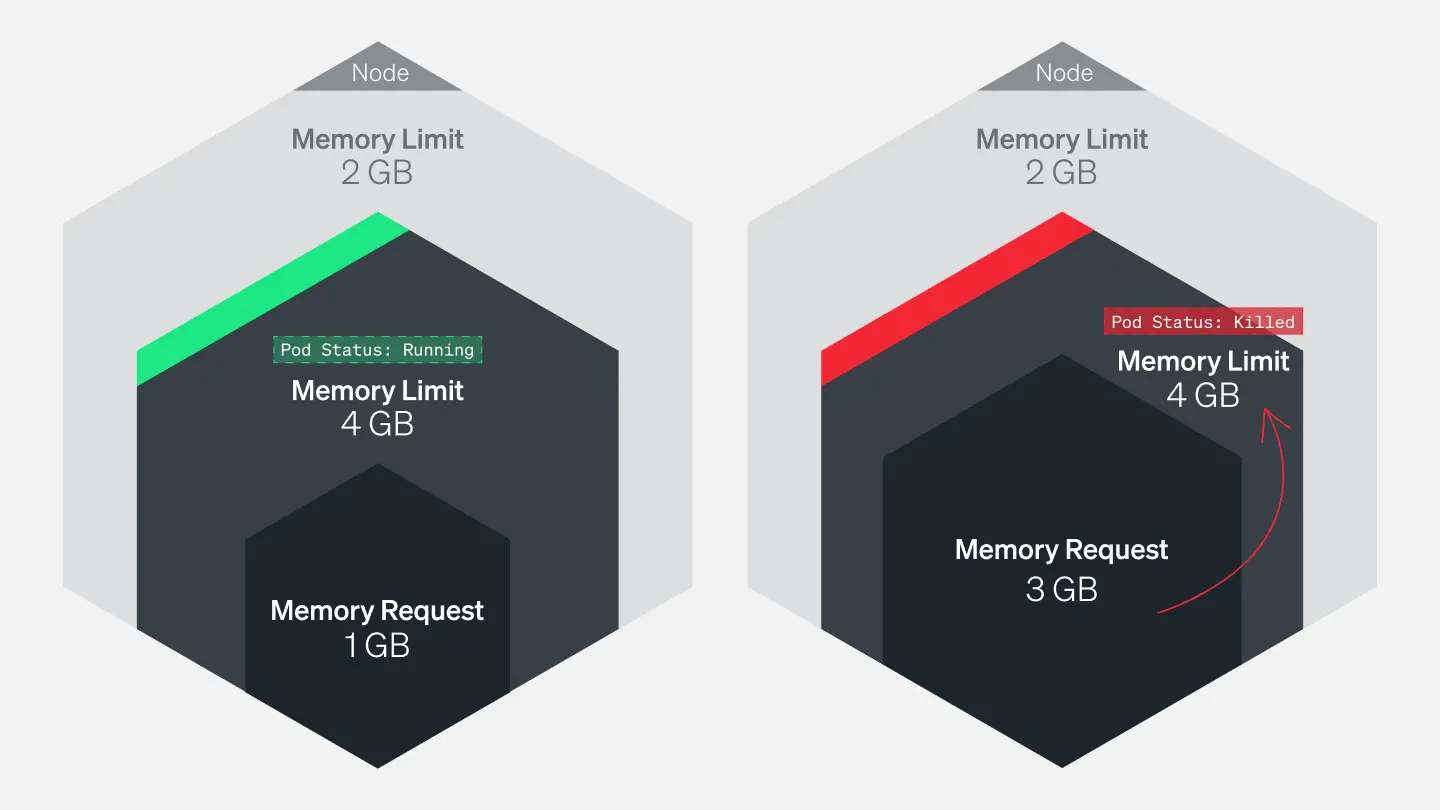
Tracking pods’ actual memory usage in relation to their specified limits is particularly important because memory is a non-compressible resource. In other words, if a pod uses more memory than its defined limit, the kubelet can’t throttle its memory allocation, so it terminates the processes running on that pod instead. If this happens, the pod will show a status of OOMKilled.
Comparing your pods’ memory usage to their configured limits will alert you to whether they are at risk of being killed because they are out of memory (OOM), as well as whether their limits make sense. If a pod’s limit is too close to its standard memory usage, the pod may get terminated due to an unexpected spike. On the other hand, you may not want to set a pod’s limit significantly higher than its typical usage because that can lead to poor scheduling decisions.
For example, a pod with a memory request of 1gibibyte (GiB) and a limit of 4GiB can be scheduled on a node with 2GiB of allocatable memory (more than sufficient to meet its request). But if the pod suddenly needs 3GiB of memory, it will be killed even though it’s well below its memory limit.
Memory requests and allocatable memory per node
Memory requests are the minimum amounts of memory a node’s kubelet will assign to a container.
If a request is not provided, it will default to whatever the value is for the container’s limit (which, if also not set, could be all memory on the node). Allocatable memory reflects the amount of memory on a node that is available for pods. Specifically, it takes the overall capacity and subtracts memory requirements for OS and Kubernetes system processes to ensure they won’t compete with user pods for resources.
Although node memory capacity is a static value, its allocatable memory (the amount of compute resources that are available for pods) is not. Maintaining an awareness of the sum of pod memory requests on each node, versus each node’s allocatable memory, is important for capacity planning. These metrics will inform you if your nodes have enough capacity to meet the memory requirements of all current pods and if the kube-scheduler is able to assign new pods to nodes. To learn more about the difference between node allocatable memory and node capacity, see Reserve Compute Resources for System Daemons in the Kubernetes documentation.
The kube-scheduler uses several levels of criteria to determine if it can place a pod on a specific node. One of the initial tests is whether a node has enough allocatable memory to satisfy the sum of the requests of all the pods running on that node, plus the new pod. To learn more about the scheduling process criteria, see the node selection section of the Kubernetes scheduler documentation.
Comparing memory requests to capacity metrics can also help you troubleshoot problems when launching and running the number of pods that you want to run across your cluster. If you notice that your cluster’s count of current pods is significantly less than the number of pods you want, these metrics might show you that your nodes don’t have the resource capacity to host new pods. One straightforward remedy for this issue is to provision more nodes for your cluster.
Measuring CPU utilization
One CPU core is equivalent to 1000m (one thousand millicpu or one thousand millicores). If your container needs one full core to run, specify a value of 1000m or just 1. If your container needs 1⁄4 of a core, specify a value of 250m.
CPU is a compressible resource. If your container starts hitting your CPU limits, it will be throttled. CPU will be restricted and performance will degrade. But it won’t be killed.
To get important insight into cluster performance, you’ll need to track two things:
Track the amount of CPU your pods are using compared to their configured requests and limits.
Track the CPU utilization at the node level.
Much like a pod exceeding its CPU limits, a lack of available CPU at the node level can lead to the node throttling the amount of CPU allocated to each pod.
Measuring actual utilization compared to requests and limits per pod will help determine if these are configured appropriately and your pods are requesting enough CPU to run properly. Alternatively, consistently higher than expected CPU usage might point to problems with the pod that need to be identified and addressed.
Here’s a NRQL query that shows the CPU requests and allocatable CPU per node. Try it on your cluster:
1. SELECT 2. filter(sum(`node_namespace_pod_container:container_cpu_usage_seconds_total:sum_irate`), where true) / 3. filter(sum(kube_pod_container_resource_requests), WHERE (resource = ‘cpu’) and job = ‘kube-state-metrics’) * 100 as ‘CPU Request Commitment’ 4. FROM Metric FACET node since 1 minute ago
Here’s a NRQL query that shows the CPU requests and allocatable CPU per pod. Try it on your cluster:
SELECT sum(`node_namespace_pod_container:container_cpu_usage_seconds_total:sum_irate`) / filter(sum(kube_pod_container_resource_limits), WHERE (resource = ‘cpu’) and job = ‘kube-state-metrics’) * 100 as ‘CPU Limit Commitment’ FROM Metric FACET pod since 1 minute ago
How to optimize Kubernetes resource allocation
To optimize your resource allocation, you’ll need to define pod specs, resource quotas, and limit range.
Define pod specs
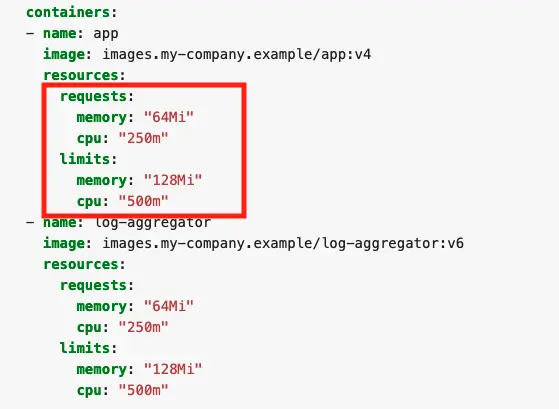
Here is a typical pod spec for resources:
Each container in the pod can set its own requests and limits which are all additive. So in this example, the pod has a total request of 64 mebibyte (MiB) of memory, and a total limit of 128 MiB. Keep in mind that if you put a request for CPU above the core count of your biggest node, your pod will never be scheduled. Unless your application is specifically architected to take advantage of multiple cores, it is generally good to keep your CPU request below 1 and leverage replicas to scale horizontally.
Define resource quotas
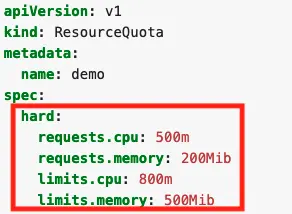
Without guardrails, developers can allocate any amount of resources to their applications running on Kubernetes. When several teams share a cluster with a fixed number of nodes, this becomes a problem. Kubernetes allows administrators to set hard limits for resource usage in namespaces with ResourceQuotas.
If you apply this file to a namespace, you’ll set the following requirements for all the containers of the namespace:
The sum of all the CPU requests can’t be higher than 0.5 cores.
The sum of all the CPU limits can’t be higher than 0.8 cores.
The sum of all the memory requests can’t be higher than 200 MiB.
The sum of all the memory limits can’t be higher than 500 MiB.
This means you could have 50 containers with 4 MiB requests, five containers with 40 MiB requests, or even one container with 200 MiB requests.
Define limit range
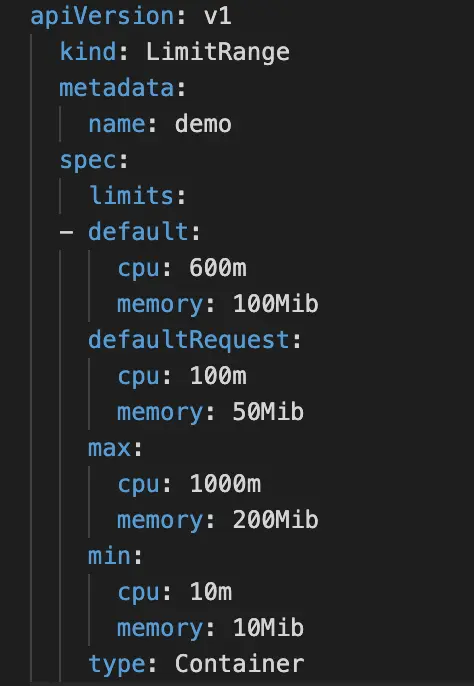
You can also create a LimitRange for a namespace. Instead of looking at the namespace as a whole, a LimitRange applies to individual containers.
Here’s an example of what a LimitRange might look like:
The default section sets the default limits for a container in a pod. If you use the values in the LimitRange, any containers that do set ranges themselves will get assigned the default values.
The defaultRequest section sets the default requests for a container in a pod. If you use the values in the LimitRange, any containers that do set ranges themselves will get assigned the default values.
The max section will set up the maximum limits that a container in a pod can set. The default section and limits set on a container cannot be higher than this value. One thing to note, if the max value is set and the default is not, any containers that do not set these values themselves will get assigned the max value as the limit.
The min section will set up the minimum requests that a container in a pod can set. The defaultRequest section and requests set on a container cannot be lower than this value. One thing to note: if this value is set and the defaultRequest is not, the min value becomes the defaultRequest value.
Conclusion
Now that you’ve learned the basics of Kubernetes and why it needs monitoring in part one and had a deep dive into Kubernetes architecture here in part two, you might want to try out a few things on your own.
A growing number of tools and frameworks are dedicated to helping visualize Kubernetes infrastructure efficiency. Here are two examples:
Kubecost provides real-time cost visibility and insights for teams using Kubernetes, helping you continuously reduce your cloud costs.
Open Cost is a vendor-neutral open source project for measuring and allocating infrastructure and container costs in real time. (New Relic is a founding contributor.)
Next steps
If you’re ready to try monitoring Kubernetes in your own environment, we also provide a pre-built dashboard and set of alerts for Kubernetes. To use it, sign up for a New Relic account today.
Creating dashboards with Terraform and JSON templates
Prerequisites
Note: To create New Relic dashboards in Terraform using JSON templates, you need to be using provider version 3.4.0 or above.
To follow along with the sample code in this tutorial, you’ll need to have Terraform installed. For instructions for installing Terraform and guidance on how to run the examples, see the Github repository nr-terraform-json-dashboard-examples.
Creating a dashboard using JSON
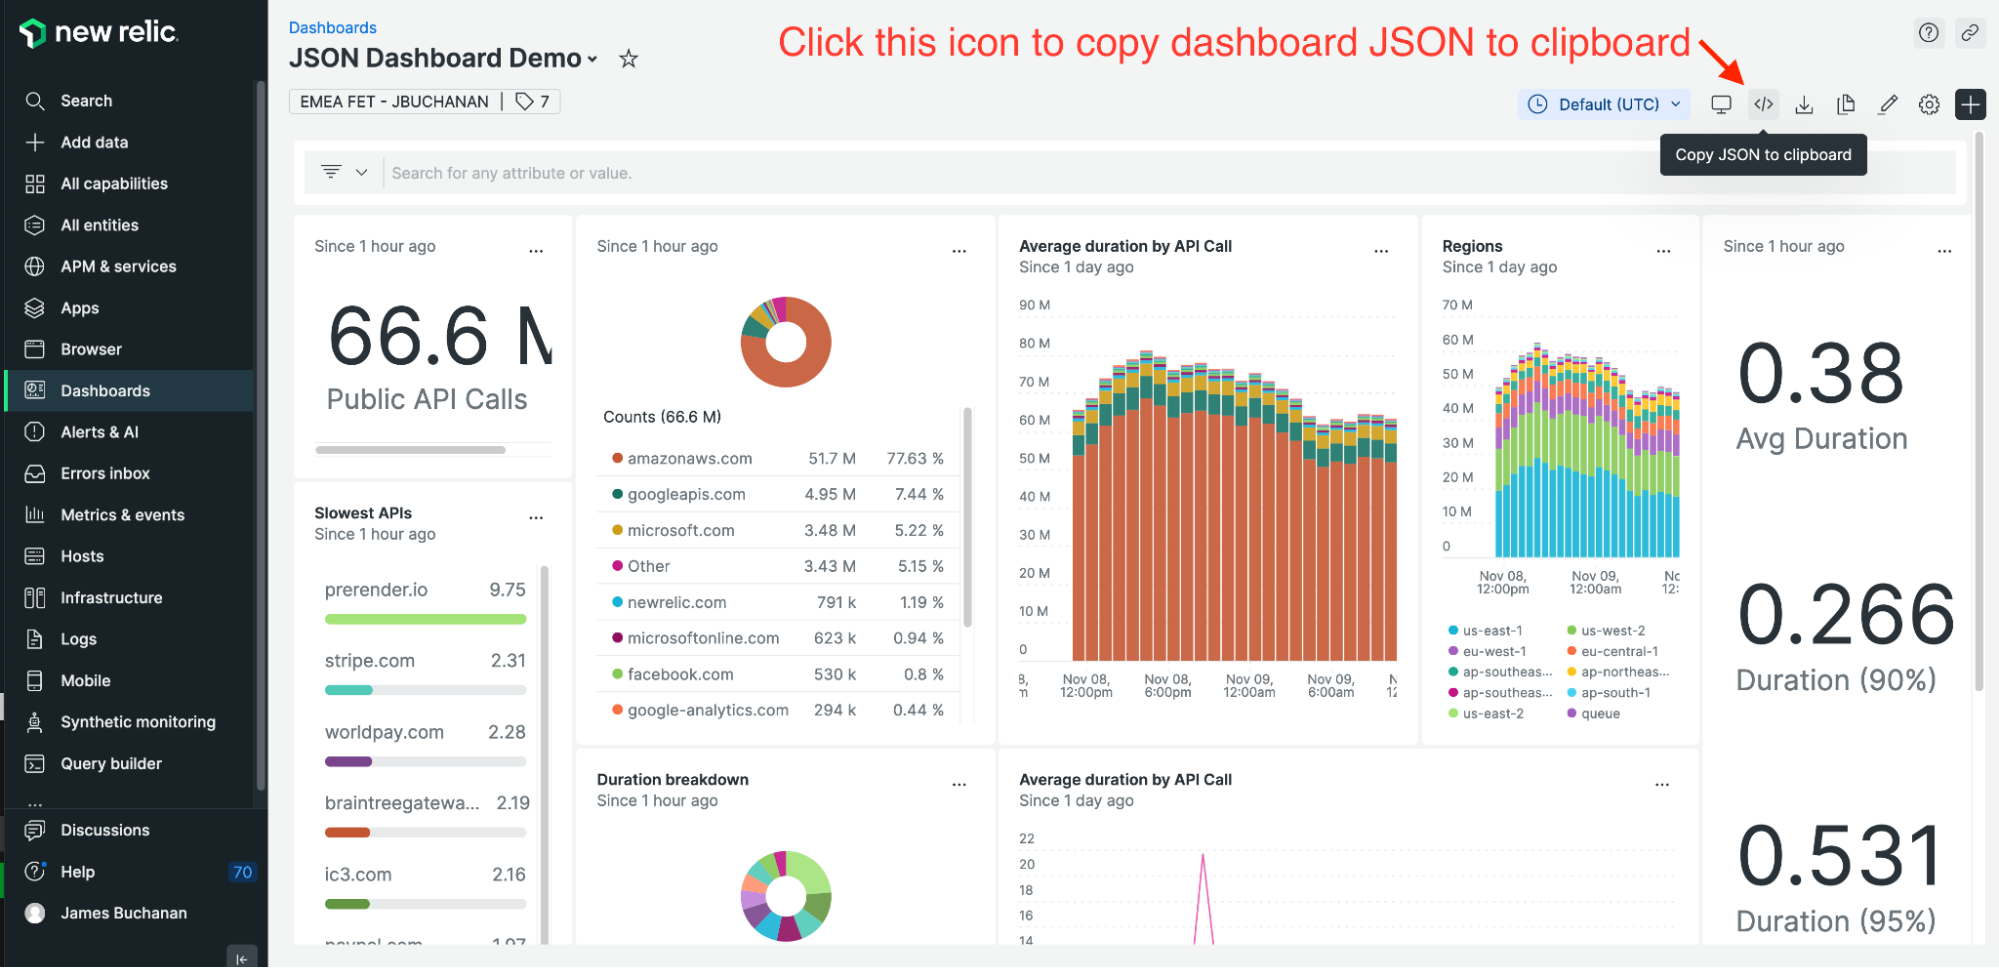
First, get the JSON configuration of any dashboard in New Relic. The dashboard you choose doesn’t matter—you just need the JSON for this tutorial. Find an existing dashboard or create a new one using the New Relic UI and select the Copy JSON to clipboard icon in the top right of the dashboard.
Create a directory in your Terraform project called dashboards and paste the JSON from your clipboard into a new file called dashboard.json. You should update the first “name” attribute in dashboard.json in order to distinguish it from the dashboard you used as a source.
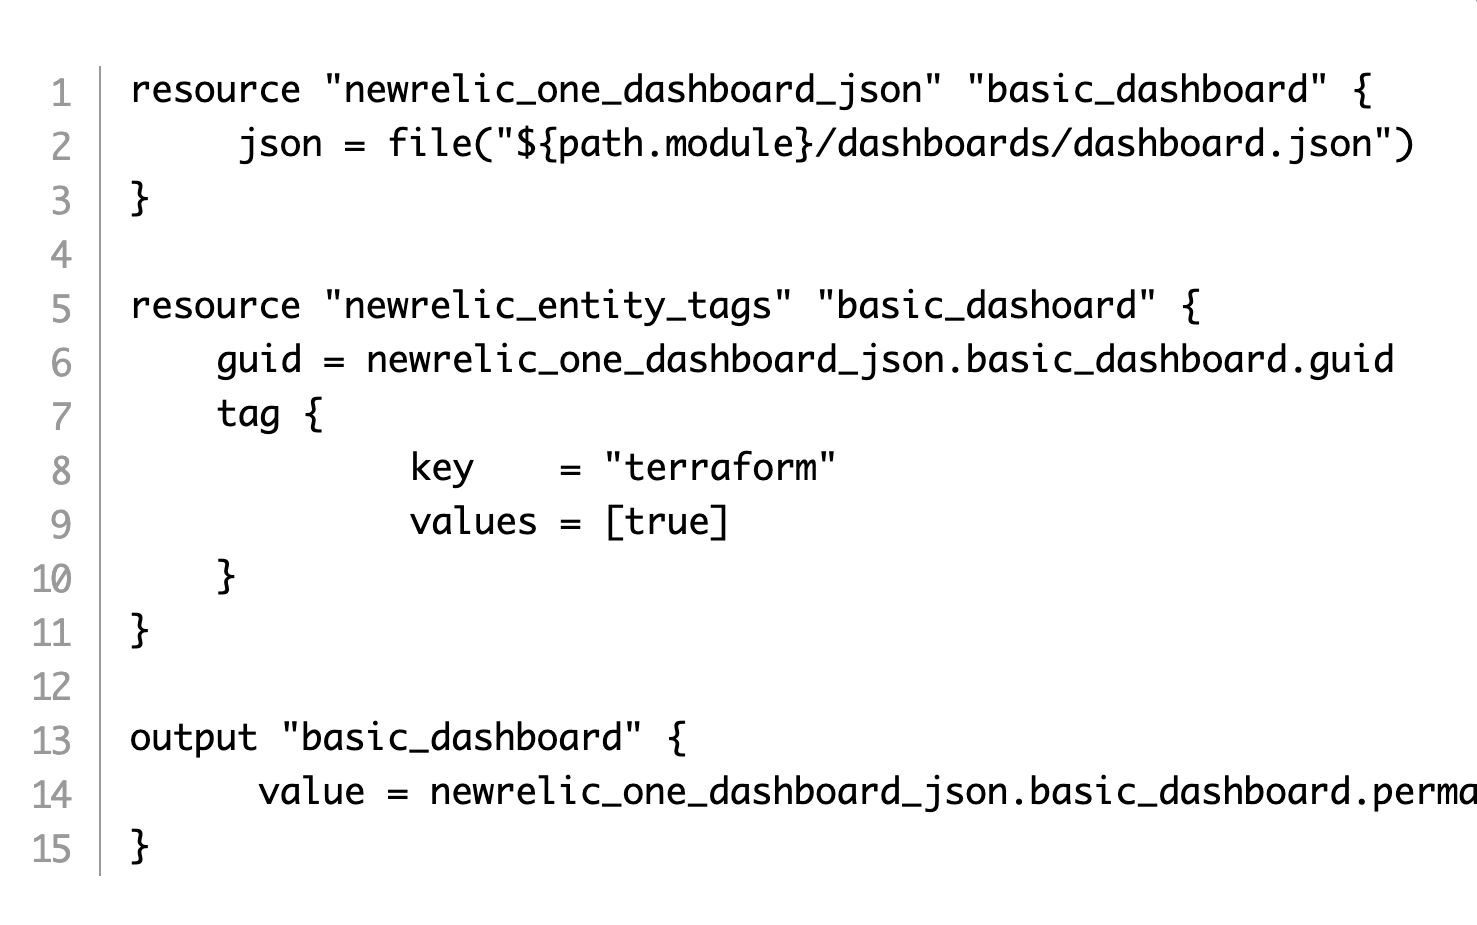
You then need to set up your Terraform configuration to use this dashboard.json as an input. To do that create a file called dash_basic.tf and enter the following HCL code:
The first block passes dashboard.json to the newrelic_one_dashboard_json resource.
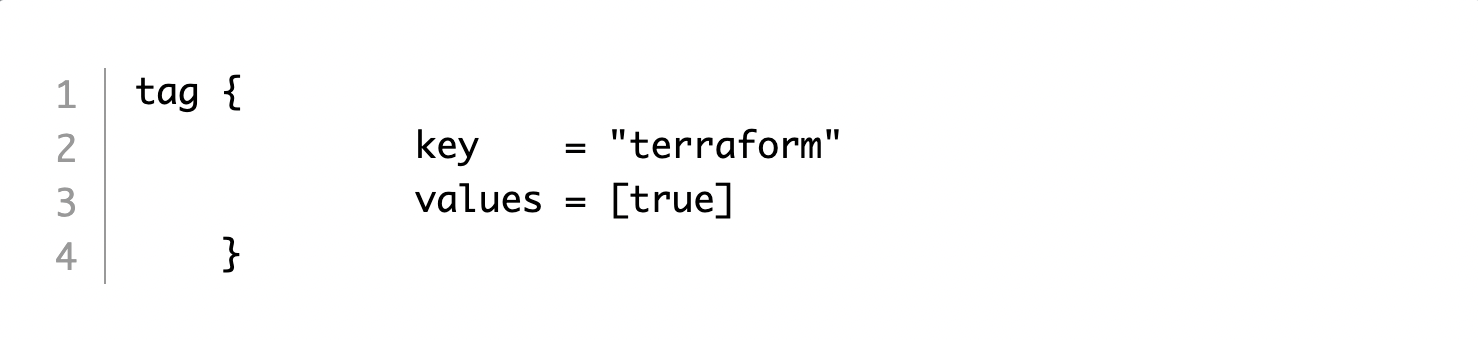
The second block tags the dashboard so you know it’s Terraform-managed, which is a best practice. In this case, the value of the tag is:
Finally, the third block outputs the dashboard permalink to the console so it’s easy to find.
Apply your Terraform and confirm the dashboard is created as expected.
Updating a dashboard
It’s simple enough to create a dashboard but how should you approach updates? Let’s take a look.
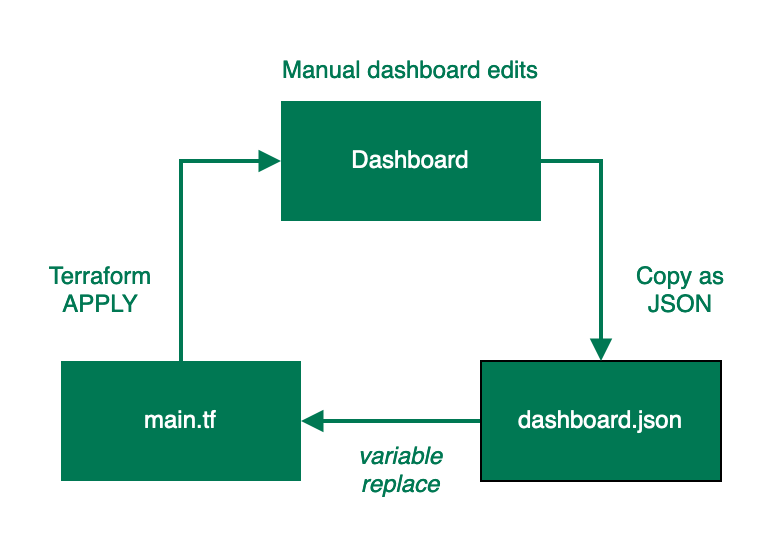
Single-use dashboards
This flow chart shows the process for maintaining a single-use dashboard.
Simply edit the dashboard in the New Relic UI, copy the new JSON configuration to your clipboard, update the dashboard.json file in your project, and reapply your Terraform.
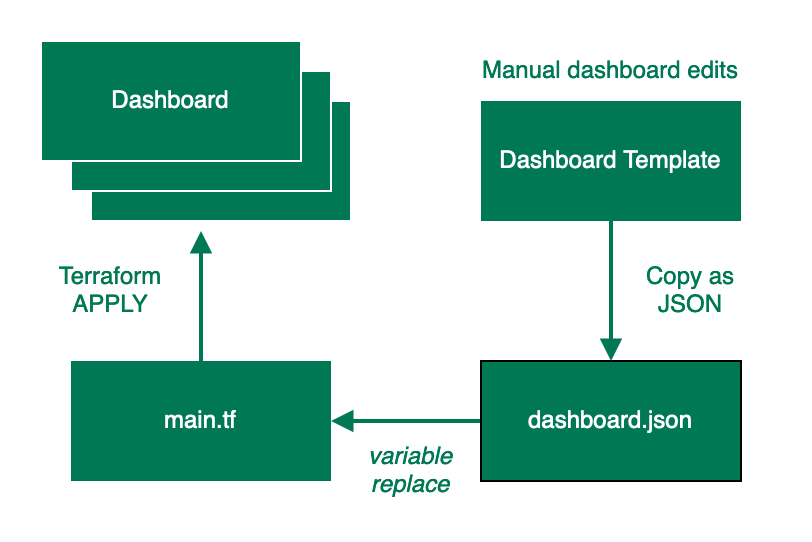
Multi-use dashboards
What if you want to do more with your dashboards? For example, you might want to take a template dashboard and deploy it multiple times with some contextual changes in each dashboard.
One solution is to create a ‘template’ dashboard that you maintain in the New Relic UI. When you want to change your deployed dashboards, you edit the template dashboard, copy the JSON into your dashboard.json file, and then reapply.
Here’s a flow chart that details what that process looks like.
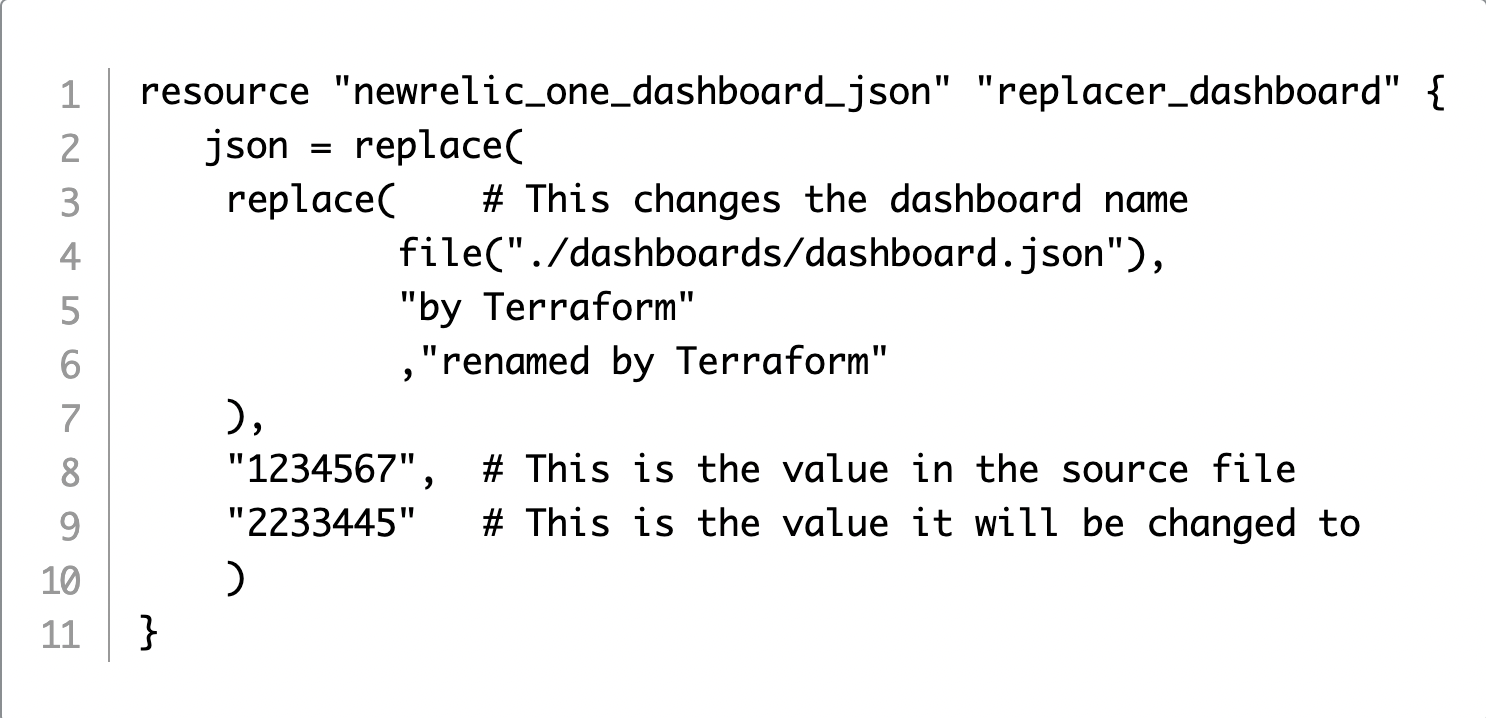
If you’re only making small changes to each dashboard that’s deployed, such as updating an appName or account ID, then you can use the Terraform replace() function to switch out values in the source template for new values in the deployed dashboards.
For example, the next Terraform code example for dash_replacer.tf changes the dashboard name and sets the account ID:
The nice thing about this approach is that anytime you need to update a dashboard, you can simply edit the template dashboard, copy and paste your JSON into the template file, and redeploy.
If you want to make many changes in a template at deployment time, you can use the Terraform templatefile which gives you better control of your changes. However, you’ll have to update your configuration so that it’s compatible with the Terraform templatefile. The dash_templatefile.tf file in the example repo shows an example of this in action.
As you can see, it’s fairly simple to create new dashboards this way—or to redeploy dashboards with a few minor tweaks. But what if you want to do something more complex, such as dynamically creating a dashboard? You’ll learn how to do that in part two of this series.
Whether you’re in development or testing, you’re deploying a production instance, or you need an instance to work with for development, you’ll want to deploy the New Relic infrastructure monitoring agent.
The great news is that deploying the New Relic infrastructure agent on an Amazon EC2 Amazon Linux instance is a quick. How quick? That depends on how fast you click. (Watch the video in the next section to see me deploy 9 instances in 23 seconds.)
Amazon Linux, provided by Amazon Web Services (AWS), is an environment for applications running on Amazon EC2.
To jump in and try out installing the New Relic infrastructure agent on just one instance, you can follow this quickstart:
But the best news is that once you’ve launched your instances, you’ll start seeing data in New Relic within just 60 seconds.
3 … 2 … 1 … launch!
There are several ways to deploy the New Relic infrastructure agent. One is to launch an Amazon EC2 instance, SSH into it, and manually deploy the agent. Or you can use AWS CloudFormation to take care of everything. Or, you can even use automation tools.
Regardless of your path, nothing beats the sheer speed of kicking off EC2 instances yourself and deploying the latest version of the New Relic infrastructure agent simultaneously. Here’s how to do it.
First, some ground rules
If you don’t already have one, you’ll need a New Relic account.
Get your New Relic ingest-license key from API keys. Find your API keys by clicking your account name (in the lower left). Use the three dots on the right side to copy your key.
You’ll also need an AWS account. If you don’t have one, get one at aws.amazon.com.
For this demo, I’ll be using Amazon Linux 2. You’ll need to substitute the proper code if you are using other versions of Linux.
Basic steps
There are 5 basic steps to installing the infrastructure agent on AWS:
1. Launch an instance from the AWS Amazon EC2 console and give it a name.
2. Select Amazon Linux 2 AMI.
3. Select your options for:
key pair
network (Select a security group that allows HTTP traffic.)
storage
4. Open Advanced details. (This is where the magic happens.)
5. Select Launch instance to complete the process.
The magic in step 4
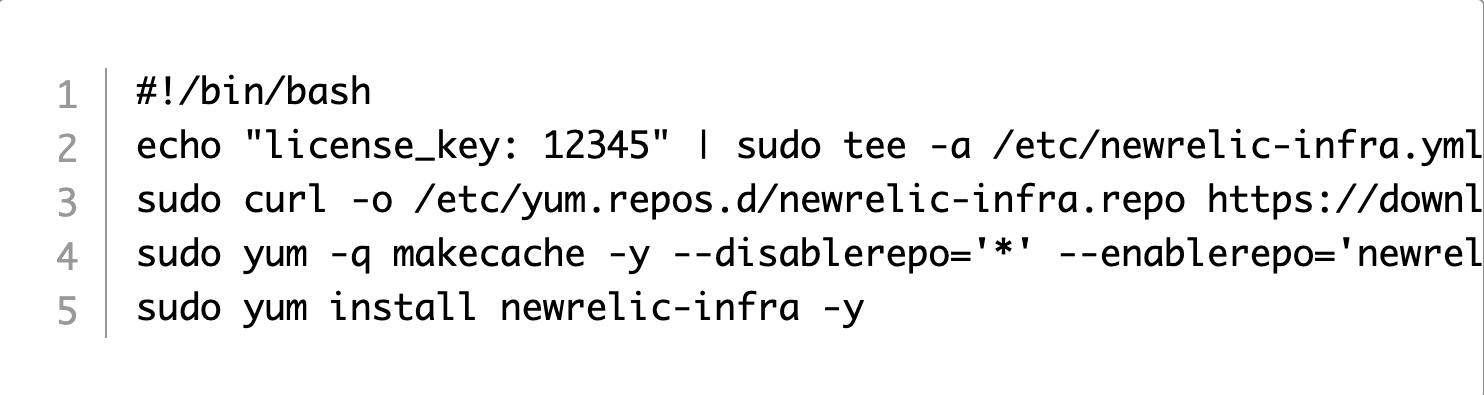
In step 4, where you configure the advanced details, look for a section at the bottom labeled User data. Copy and paste this short script in the User data field (don’t select base64). Then replace [YOUR_KEY] with your license key.
Syntax counts! Copy/paste may modify the quote marks or dashes. If you are experiencing issues with your copy/paste, double-check your single and double quotation marks and double-dashes.
Here’s an example with a license key of 12345:
Next steps
Feel free to share this with anyone who needs to know how fast and easy it is to deploy the New Relic infrastructure monitoring agent to an Amazon EC2 instance.
10 common struggles with cloud-native infrastructure
1. Inefficiencies are a big deal when you’re paying in a utility model.
Utility-style pricing is different for cloud-native infrastructure than what teams might be used to for purchased physical or virtual servers. There are additional costs in cloud-native architecture, and you’ll need to manage costs properly in a utility-style pricing model. Cost is variable and proportionate to compute consumption.
With both on-premises deployments and more traditional migrated architectures—for example, Amazon EC2 instances—you have a series of stepped sunk costs, such as physical or virtual machines. One modernization option is to adopt serverless functions here instead. But individual serverless functions can cost more money in cloud-native architectures if not properly defined. High memory, high concurrency and long-running functions can increase the costs exponentially if your function is designed to scale out. Identifying inefficient cloud resources is critical with cloud-native infrastructure to avoid additional costs.
2. You’re working with short-lived components and variable microservices.
With on-premises or hosted instances, you have a known, fixed pool of compute resources. Cloud-native microservices, on the other hand, are typically on-demand, elastic in both quantity and duration, often stateless, and are ephemeral in nature, only existing while needed. If a microservice no longer exists or has changed state, it’s hard to determine what went wrong at a point in the past.
With New Relic, you can see telemetry over time and correlate that with user complaints, event notifications, or performance anomalies. You can record and monitor deployments, tracking them with deployment markers so you can correlate them with your application’s performance.
3. You have little insight into underlying infrastructure.
When you move to cloud-native infrastructure, a big challenge is simply the lack of insight. You don’t know what’s going on with the underlying infrastructure.
You need an observability solution that can help you determine what services are the source, and identify if the problems are with the cloud-based infrastructure that exists outside of your administrative control.
Cloud vendors have monitoring services, and New Relic can give you visibility across those services. This helps you determine what has gone wrong, looking across the whole of your system. With New Relic, you can establish cloud integrations for Amazon Web Services (AWS), Microsoft Azure, and Google Cloud Platform.
4. Security becomes even more important, yet more difficult.
That lack of visibility described in the previous challenge becomes even more problematic when it comes to security. It’s hard to see everything, so you might miss some important security risks. Investigation becomes costly when there is so much security data to analyze. In cloud-native infrastructure, you need to determine which data is relevant.
With many tools and multi-cloud and hybrid-cloud environments, it’s hard to enforce consistent policies. A cloud infrastructure that isn’t configured properly is at risk for attacks. All this, and you need to be able to respond quickly.
With New Relic, you can integrate with your cloud provider’s security services. Check out integrations including AWS CloudTrail. If you’re tired of silos and additional configuration, using New Relic vulnerability management can help you get your observability and security all in one place.
5. Increase in development and release cycles requires coordination.
With cloud-native infrastructure, you’re dealing with more frequent deployment cycles and continuous integration and continuous delivery (CI/CD) pipelines. Organizations have built DevOps practices for engineering teams to collaborate using cross-functional teams, but we’ve been noticing the “shift left” trend as devs need to catch problems before they become painful and expensive to solve later.
To deploy more often, you need to ensure stability. You’ll want to track deployments so you can correlate them to your application’s performance. Here’s where deployment markers help you understand cause and effect, seeing when issues happened related to deployment.
With New Relic, you’ll view these deployment markers in your application performance monitoring (APM) charts. Other ways that New Relic can help with CI/CD pipelines is through integration with CI/CD tools that you are already using and better collaboration between teams with issues visible right in your IDEs with CodeStream.
6. You need to manage and monitor multiple systems and multiple clouds.
In a static system or even a virtual machine, there are more processes and approvals for adding a new system, but in a cloud-native environment they can be added with just a line of code. Managing and monitoring all these changes from the quick proliferation of resources and services can be overwhelming.
Despite this disorderly environment, engineering teams still need to maintain the availability, performance, and security of their applications, even when they span multiple cloud environments, physical machines, virtual machines, containers, stateful containerized workloads, orchestration engines, and serverless platforms.
You’ll need visibility across all these systems and clouds, without being locked into using one particular cloud vendor. An observability platform that lets you see everything in one place, but still integrate with other tools you’re using, helps you move through the chaos.
7. It’s difficult to manage system configuration settings.
Ideally there will be a single source of truth for infrastructure-as-code, but in practice some settings can’t be centrally managed or implemented through code. Also, systems configurations can drift over time as application owners and systems operators make localized changes outside the deployment pipeline.
Once that drift happens, you no longer have a predictable environment that everyone can understand. Configuration drift increases with complexity, like you have with cloud-native infrastructure.
With New Relic, you can identify specific components, services, or configurations that are operating in anomalous or unpredictable ways. You can quickly use data to determine the actual behavior and how it differs from intended operation.
8. You need to deal with an abundance of flexibility and overcome analysis paralysis.
When you have so many choices, figuring out the right choice is critical. Monitoring all the pieces of your cloud-native environment means you can collect a lot of data. But how do you make sense of it without being stuck?
You need an observability platform where you can weigh your choices and optimize for the best action. Consider the cost-performance ratio between different cloud services, and how to rightsize your environments. With the right data, you can experiment and fail fast, then move on quickly. With New Relic you can get deep visibility into all your infrastructure in one place.
For example, instead of manually sifting through dashboards to understand why problems occur and what they affect, you can get to the root cause of every incident.
9. Reliability issues are entwined in your cloud-native architecture.
Even within a cloud, you must architect the right way to use the cloud capabilities to avoid reliability issues. Some groups might use multiple regions, and achieving reliability can be challenging and costly.
Within a cloud, you want to have observability into your reliability. Then you’ll be able to see whether or not your approaches are successful by observing uptime, overall performance metrics like slow page load time. Architecting for reliability is not enough—you’ll need to be able to observe reliability, all along the way, from the frontend user experience to the infrastructure in the backend.
Reliability can take a lot of different formats. You often might not know where your risks are. So you can’t make decisions about highly available architecture without observing over time.
You’ll need an observability tool to see where your reliability is paying off. Learn how to successfully influence reliability decisions with New Relic.
10. You need both organizational shift and teams staffed with the right skills.
As organizations transition to working with cloud-native infrastructure, they find that their teams’ DevOps process and culture needs to shift to CI/CD pipelines, as discussed in Challenge 5. But teams also need new skills as they shift their culture.
When there are outages in a cloud-native environment, it’s all hands on deck. Teams will need to build cloud architect skills. Specialized expertise includes building and architecting microservices-based applications, container- and Kubernetes-based applications, and applications that leverage the services from public cloud providers.
The shift in culture needed with cloud-native architecture naturally aligns with a culture of observability. When micro-failures are expected and rapidly mitigated, everyone needs observability, both operations and development teams. Both dev and ops engineers care about metrics like Apdex, average response time, error rates, and throughput.
With observability, you can deal with these failures quickly. You get the freedom to become more nimble.
How New Relic can help?
One temptation with all these challenges is to expect monitoring services that are included with your cloud providers to take care of all your concerns. Cloud vendors are amazing at providing basic building blocks. But when it comes to observability, you need deep capabilities with customization, and you’re not going to get there with the built-in cloud monitoring tools.
You need full-stack observability to get the insights in a dedicated platform. With New Relic, you have one place for unified visibility into all your telemetry, across multiple tools and across your entire system. You can see change in the context of your entire system, visualize relationships and dependencies across your cloud-native infrastructure, and quickly find root causes.
Kubernetes, often abbreviated as “K8s,” is an open source platform that has established itself as the de facto standard for container orchestration. Usage of Kubernetes has risen globally, particularly in large organizations, with the CNCF in 2021 reporting that there are 5.6 million developers using Kubernetes worldwide, representing 31% of all backend developers.
As a container orchestration system, it automatically schedules, scales, and maintains the containers that make up the infrastructure of any modern application. The project is the flagship project of the Cloud Native Computing Foundation (CNCF). It’s backed by key players like Google, AWS, Microsoft, IBM, Intel, Cisco, and Red Hat.
What can Kubernetes do?
Kubernetes automates the mundane operational tasks of managing the containers that make up the necessary software to run an application. With built-in commands for deploying applications, Kubernetes rolls out changes to your applications, scales your applications up, and down to fit changing needs, monitors your applications, and more. Kubernetes orchestrates your containers wherever they run, which facilitates multi-cloud deployments and migrations between infrastructure platforms. In short, Kubernetes makes it easier to manage applications.
Automated health checks
Kubernetes continuously runs health checks against your services. For cloud-native apps, this means consistent container management. Using automated health checks, Kubernetes restarts containers that fail or have stalled.
Automated operations
You can automate mundane sysadmin tasks using Kubernetes since it comes with built-in commands that take care of a lot of the labor-intensive aspects of application management. Kubernetes can ensure that your applications are always running as specified in your configuration.
Infrastructure abstraction
Kubernetes handles the compute, networking, and storage on behalf of your workloads. This allows developers to focus on applications and not worry about the underlying environment.
How Kubernetes changes your monitoring strategy
If you ever meet someone who tells you, “Kubernetes is easy to understand,” most would agree they are lying to you!
Kubernetes requires a new approach to monitoring, especially when you are migrating away from traditional hosts like VMs or on-prem servers.
Containers can live for only a few minutes at a time since they get deployed and re-deployed adjusting to usage demand. How can you troubleshoot if they don’t exist anymore?
These containers are also spread out across several hosts on physical servers worldwide. It can be hard to connect a failing process to the affected application without the proper context for the metrics you are collecting.
To monitor a large number of short-lived containers, Kubernetes has built-in tools and APIs that help you understand the performance of your applications. A monitoring strategy that takes advantage of Kubernetes will give you a bird’s eye view of your entire application’s performance, even if containers running your applications are continuously moving between hosts or being scaled up and down.
Increased monitoring responsibilities
To get full visibility into your stack, you need to monitor your infrastructure. Modern tech stacks have made the relationship between applications and their infrastructure a more complicated than in the past.
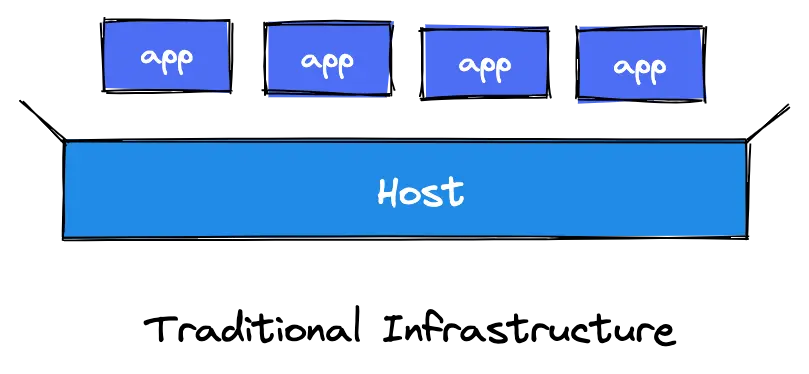
Traditional infrastructure
n a traditional infrastructure environment, you only have two things to monitor–your applications and the hosts (servers or VMs) running them.
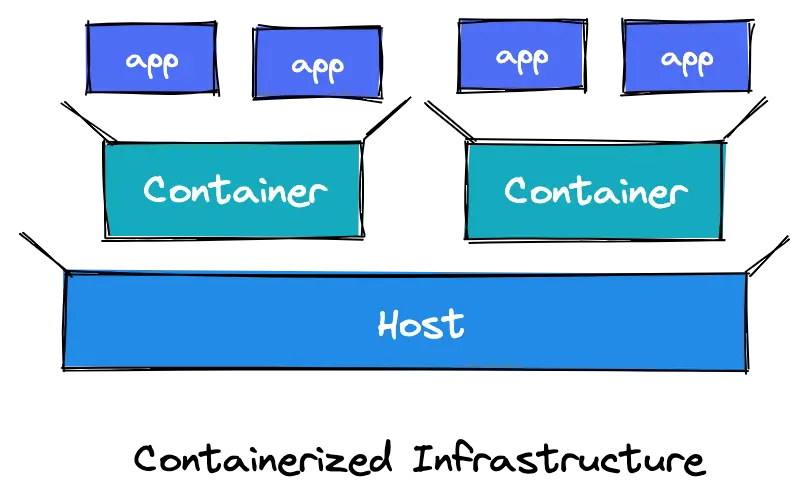
The introduction of containers
In 2013, Docker introduced containerization to the world. Containers are used to package and run an application, along with its dependencies, in an isolated, predictable, and repeatable way. This adds a layer of abstraction between your infrastructure and your applications. Containers are similar to traditional hosts, in that they run workloads on behalf of the application.
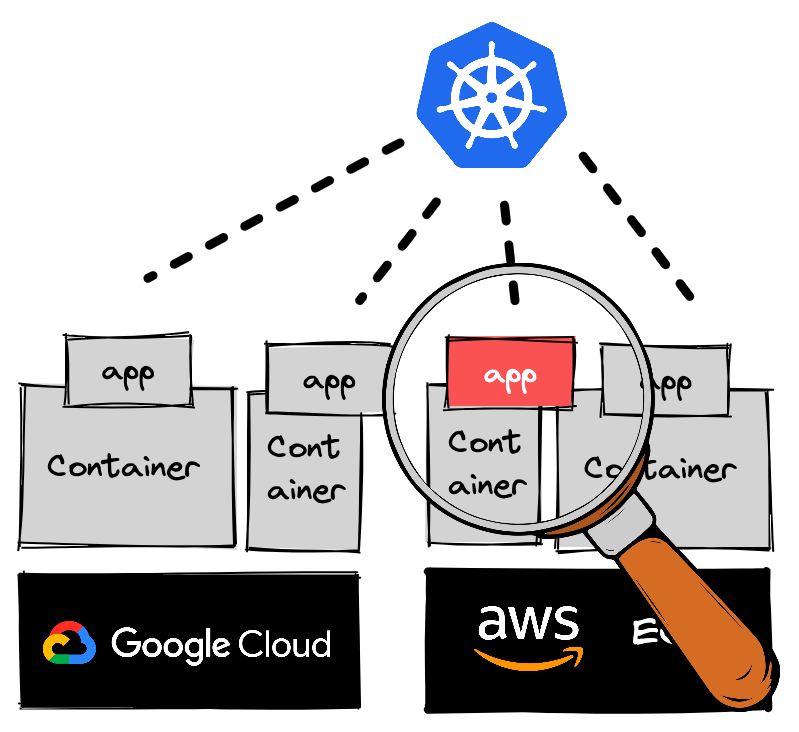
Kubernetes
With Kubernetes, full visibility into your stack means collecting telemetry data on the containers that are constantly being automatically spun up and dying while also collecting telemetry data on Kubernetes itself. Gone are the days of checking a few lights on the server sitting in your garage!
There are four distinct components that need to be monitored in a Kubernetes environment each with their specificities and challenges:
Infrastructure (*worker nodes)
Containers
Applications
Kubernetes clusters (*control plane)
*These concepts will be covered in part two of this guide
Correlating application metrics with infrastructure metrics with metadata
While making it easier to build scalable applications, Kubernetes has blurred the lines between application and infrastructure. If you are a developer, your primary focus is on the application and not the cluster’s performance, but the cluster’s underlying components can have a direct effect on how well your application performs. For example, a bug in a Kubernetes application might be caused by an issue with the physical infrastructure, but it could also result from a configuration mistake or coding problem.
While making it easier to build scalable applications, Kubernetes has blurred the lines between application and infrastructure. If you are a developer, your primary focus is on the application and not the cluster’s performance, but the cluster’s underlying components can have a direct effect on how well your application performs. For example, a bug in a Kubernetes application might be caused by an issue with the physical infrastructure, but it could also result from a configuration mistake or coding problem.
When using Kubernetes, monitoring your application isn’t optional, it’s a necessity!
Most Application Performance Monitoring (APM) language agents don’t care where an application is running. It could be running on an ancient Linux server in a forgotten rack or on the latest Amazon Elastic Compute Cloud (Amazon EC2) instance. However, when monitoring applications managed by an orchestration layer, having context into infrastructure can be very useful for debugging or troubleshooting to be able to relate an application error trace, for example, to the container, pod, or host that it’s running on.
Configuring labels in Kubernetes
Kubernetes automates the creation and deletion of containers with varying lifespans. This entire process needs to be monitored. With so many moving pieces, a clear organization-wide labeling policy needs to be in place in order to match metrics to a corresponding application, pod, namespace, node, etc.
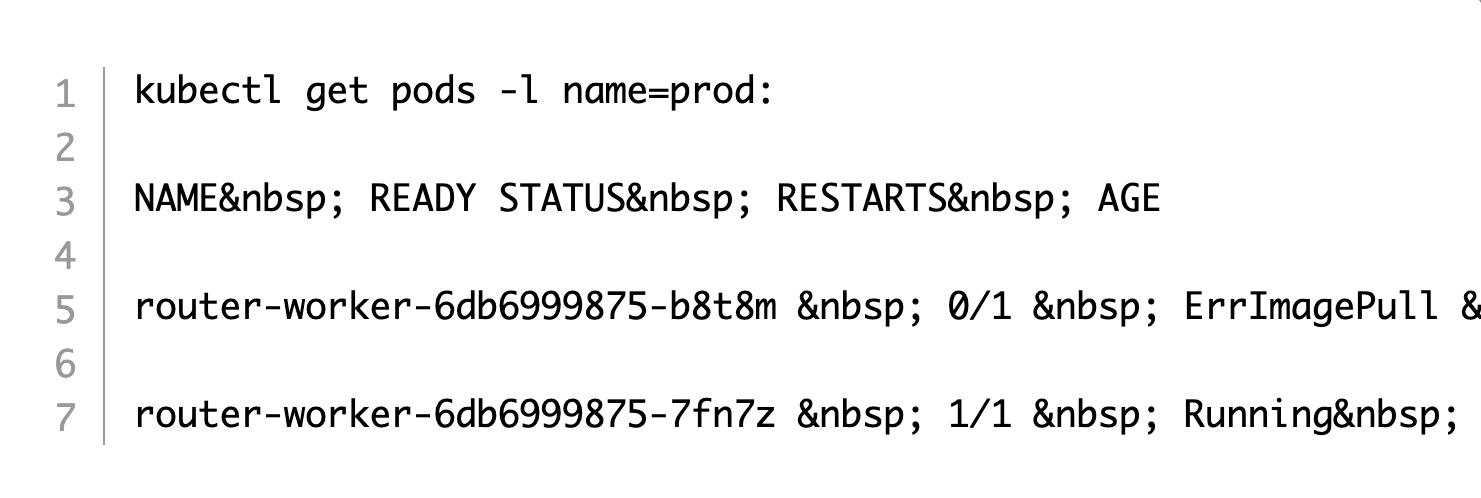
By attaching consistent labels across different objects, you can easily query your Kubernetes cluster for these objects. For example, suppose you get a call from your developers asking if the production environment is down. If the production pods have a “prod” label, you can run the following kubectl command to get all their logs.
In this example, you might spot that one of the prod pods has an issue with pulling an image and providing that information to your developers who use the prod pod. If you didn’t have labels, you would have to manually grep the output of kubectl get pods.
Common labeling conventions
In the example above, you saw an instance in which pods are labeled “prod” to identify their use by environment. Every team operated differently but the following naming conventions can commonly be found regardless of the team you work on:
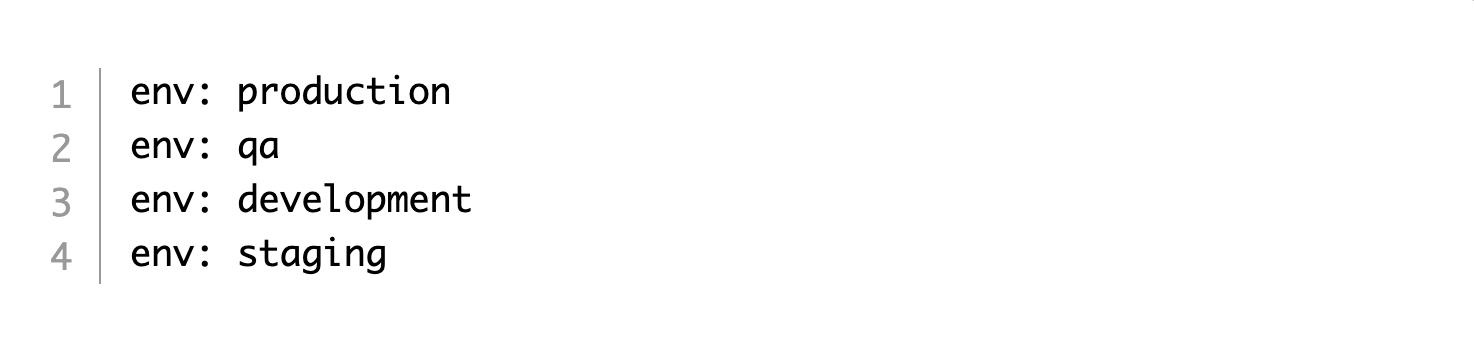
Labels by environment
You can create entities for the environment they belong to. For example:
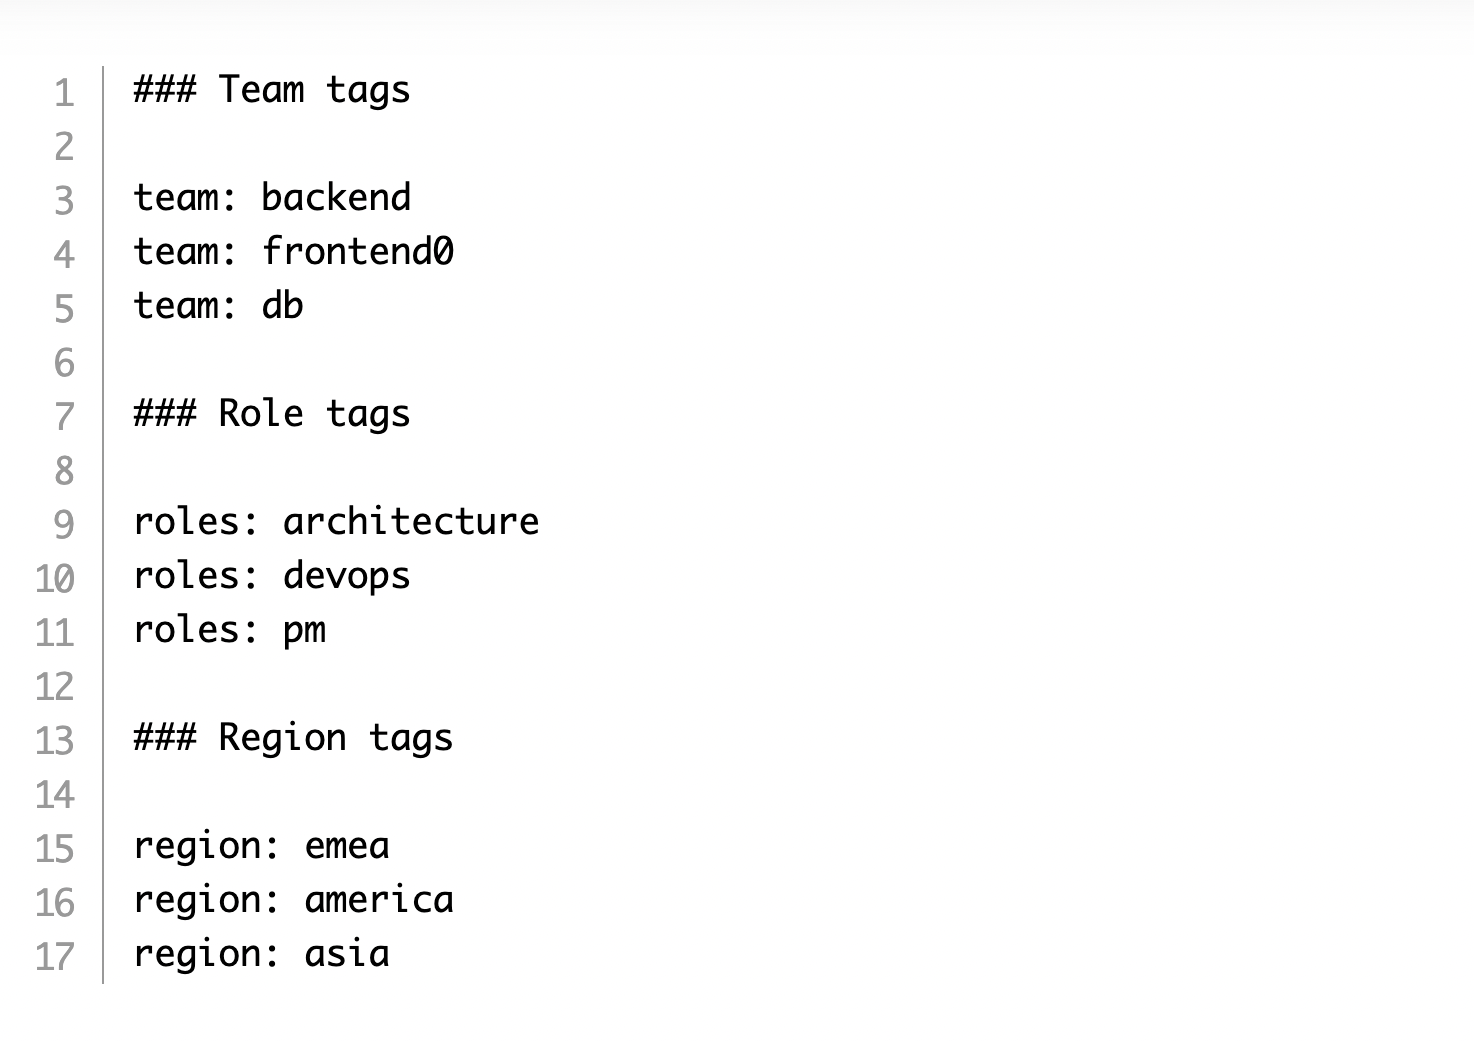
Labels by team
Creating tags for team names can be helpful to understand which team, group, department, or region was responsible for a change that led to a performance issue.
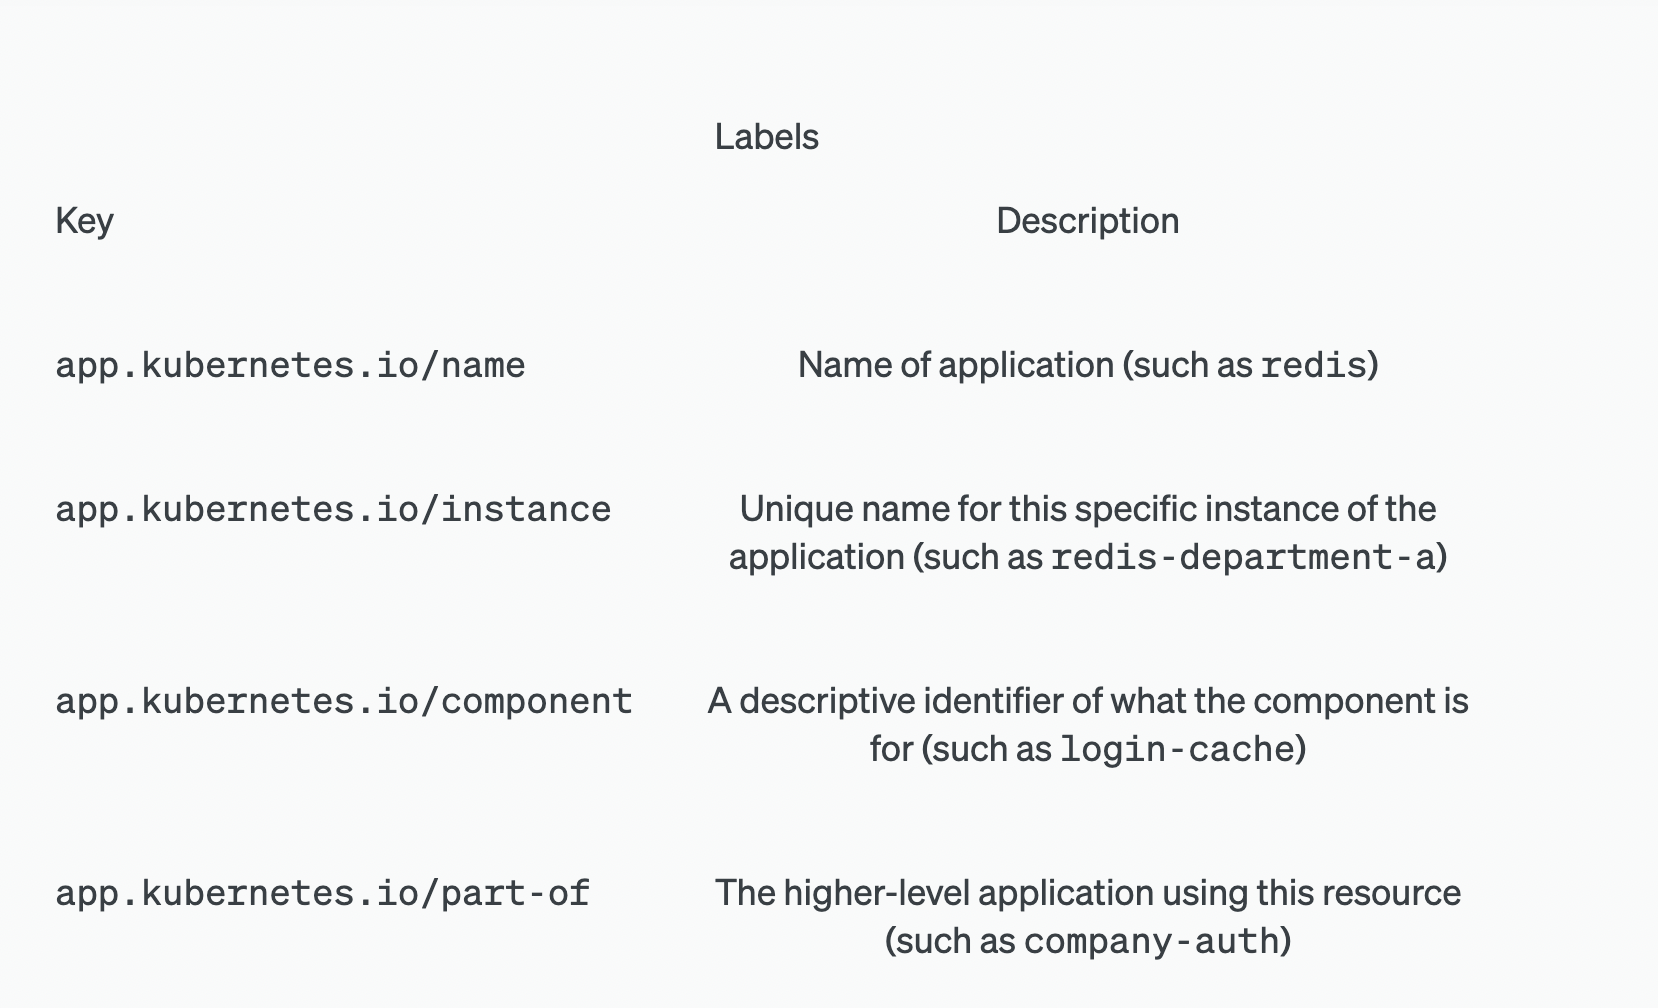
Labels by Kubernetes recommended labels
Kubernetes provides a list of recommended labels that allow a baseline grouping of resource objects. The app.kubernetes.io prefix distinguishes between the labels recommended by Kubernetes and the custom labels that you may separately add using a company.com prefix. Some of the most popular recommended Kubernetes labels are listed below.
With all of your Kubernetes objects labeled, you can query your observability data to get a bird’s eye view of your infrastructure and applications. You can examine every layer in your stack by filtering your metrics. And, you can drill into more granular details to find the root cause of an issue.
Therefore, having a clear, standardized strategy for creating easy-to-understand labels and selectors should be an important part of your monitoring and alerting strategy for Kubernetes. Ultimately, health and performance metrics can only be aggregated by labels that you set.
Conclusion
So far, we’ve covered what Kubernetes is, what it can do, why it requires monitoring, and best practices on how to set up proper Kubernetes monitoring.
In part two of this multi-part series, we’ll go through a deep dive into Kubernetes architecture.
E-commerce guide for Black Friday: Are your sites and apps ready?
Tip #1: Set your baselines and define success.
As you approach your peak periods, it’s important to understand what “good” looks like. What is normal, acceptable, or concerning about the performance of your services?
It’s a good idea to determine some baselines and KPIs so that you’re fully aware of what your platform looks like under different load profiles. Under stress, your services will likely perform differently, but how different can they be before it has a noticeable business impact? Understand what parts of the system are particularly at risk and will act as indicators for further degradation.
Make sure that all of your processes and operational agreements for the level of your services provided to customers are appropriate. Check out our observability maturity guide to service level management.
Tip #2: Plan well in advance.
Ideally, your planning should be mapped out at least six weeks in advance of the big day. With online sales starting earlier every year, this plan needs to be plotted out ASAP.
What new features will you release? What bugs will you fix first? What type of tests will you run, and when? You will also want to identify current baselines for performance and availability at the application, infrastructure, service, and frontend levels.
You should identify key performance indicators (KPIs) at each level, beginning with measuring performance, error/crash rates, and throughput. You should also create and verify application/infrastructure maps, as well as key transaction maps. Service owners should create and verify an incoming/outgoing call map. Similarly, mobile app owners should identify API calls to view internal and external dependencies.
Next, you need to set your goals and expectations for the big day. What are your availability goals? How much traffic do you expect to receive? How much cloud and infrastructure capacity do you need to put in place (both planned and dynamic) so you can scale to meet those expectations? Identify any existing or potential issues that could get in the way of meeting your goals.
With all this in mind, establish a timeline and document a detailed play-by-play for getting everything ready and have teams in place to cover the entire season. Make sure that resources are available around the clock and handoffs are scheduled in advance.
Tip #3: Know the current state of your environment.
Your load testing and game day activities might lead you to decide to reconfigure your environment to better serve peak events. For example, your Black Friday posture might require more databases to be brought online, more virtual machines (VMs) added to your cluster, and more customer service operators staffing the online chat.
When the time comes, how can you quickly and confidently know that your platform is in the correct posture for business to commence? Did Rupesh remember to scale up that cluster? Are the customer service team on a coffee break? Is the waiting room enabled?
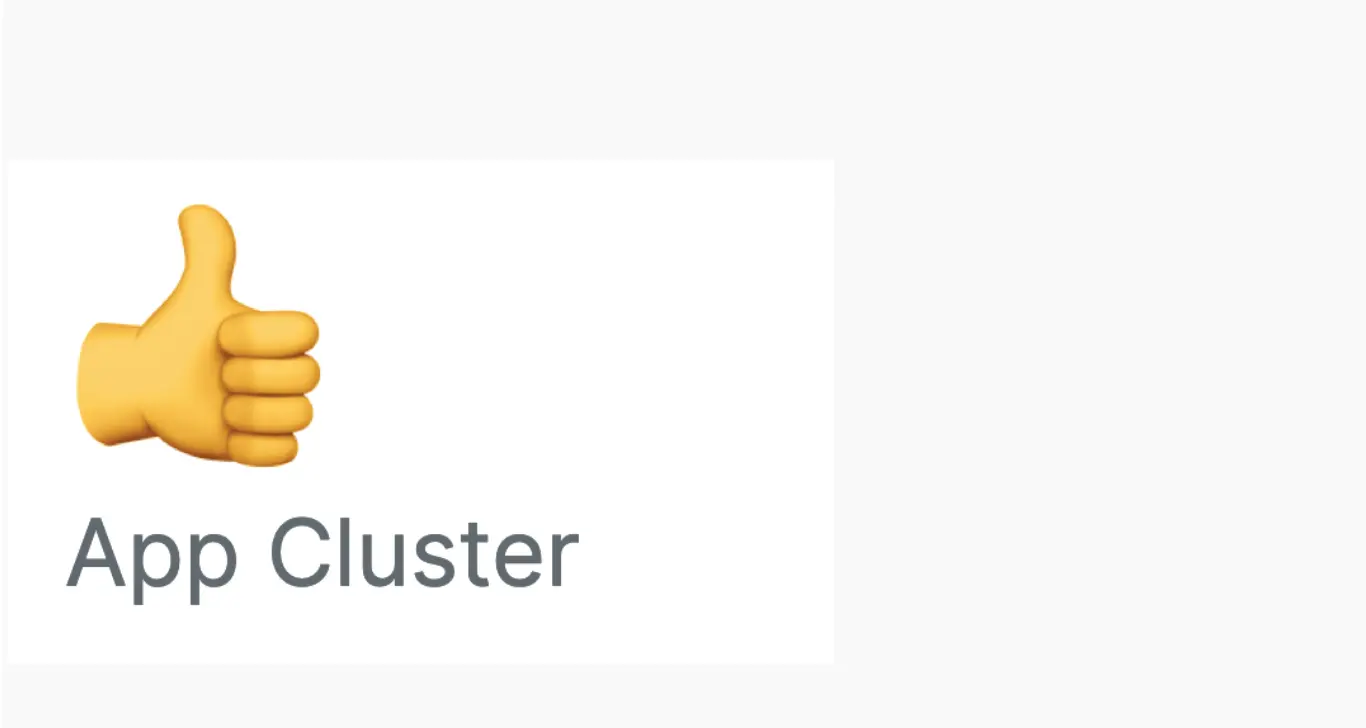
A “current state” dashboard is an essential tool to allow you to quickly understand the overall state of your environment. You can include pertinent data from across your platform services such as cluster sizes, databases, queue lengths, feature toggles, active customer service representatives etc. Your charts should be concise and clear, easy to read with low cognitive load. The billboard chart type works great, because you can set thresholds and highlight them red if they are not the values you expect. You can even use the if() NRQL syntax to simplify the data display giving you simple thumbs up or thumbs down indicators:
from SystemSample select if(uniqueCount(hostname) > 20,’👍’,’👎’) as ‘App Cluster’ since 5 minutes ago
You might need different state dashboards for different “postures,” with thresholds and indicators set differently for low traffic, normal operation and peak events. Learn more about how you can customize and use dashboards in New Relic.
Tip #4: Classify issues by business impact.
Black Friday events tend to have a lot more eyes on the data than everyday operations, and those eyes are inevitably more business-focused. How do you ensure that others will understand the data and visualizations and understand the impact of issues that arise? Suppose the severity of an issue can’t be quickly determined by this audience. In that case, you may waste time fixing irrelevant issues and miss the ones that really make a difference to your business.
One approach is to classify your issues by business impact. Agree on the classification across your services so that everyone is clear on how important a given issue is and its effect on the business without having to fully understand the issue itself. Just being able to understand a dependent service is suffering a “SEV2 incident” provides clarity at times of stress. Don’t underestimate the value of this classification. Read more about alerting strategies.
Tip #5: Set up your command center.
As you solidify your plans, assemble your cross-functional teams. Identify which team members from marketing, fulfillment, web and mobile operations, and other key functions will be involved. Assign clear roles and responsibilities to each person. Who will make the mission-critical decisions and course corrections? Who will execute which tasks? How and where will collaboration occur? Who’s in charge if incidents occur? Keep in mind that successfully navigating Black Friday and Cyber Monday is a team sport, so always think and act like a team.
When you set up the dashboards, consider high-level, “at a glance” dashboards covering both business and technology data.
Make sure the dashboards identify the contacts who own the services. Consider including links to runbooks and team contacts on relevant command center dashboards. This saves you from needing to look up the information at crucial times.
Many companies document these decisions to codify the procedures for who does what and when in runbooks, published in their Observability Center of Excellence. To give your efforts a physical focus, you may want to set up a network operations center (NOC) to house key team members, monitors with shared dashboards, and other resources.
Tip #6: Be aware of changes.
It’s important to ensure you can execute your plan, so your biggest days may not be the best time to roll out risky experiments or deal with unnecessary chaos. Be sure your plan specifies what you can and can’t do. Proper instrumentation and visibility into your software and systems enable you to innovate more confidently, but there’s no need to be reckless about it. Of course, you don’t want to leave money on the table, but you really, really don’t want to break things on Black Friday.
That’s why many companies build a timeline that includes a feature or code freeze. In order to minimize last-minute surprises, you need to specify a hard cutoff date when new features can’t be incorporated into your systems. You’ll need another date when you won’t accept any new code changes, even bug fixes. This allows QA teams to confidently verify that key customer journeys avoid any roadblocks, and helps ensure you deliver the highest quality digital customer experience when it matters most.
Deployments might be inevitable, especially in microservice architectures, or where you rely heavily on third parties. Use deployment markers or custom events to understand if and when the landscape changes. New Relic Lookout is great for investigating real-time performance changes in your environment. Be sure you understand how to use this tool before you need it!
Tip #7: Stay focused on the big picture.
With millions of dollars potentially on the line and multiple things happening at once, how do you stay focused on factors such as conversion rate, order counts, payment success rates, and Apdex for key transactions?
Building and sharing real-time business analytics dashboards give everyone visibility into user flow and performance across web, mobile, and infrastructure by tracking key metrics and user satisfaction scores. Create dashboards for business outcomes and order processes, and set up high-density views of how your apps and infrastructure are performing, as well as the quality of the digital customer experience you’re delivering.
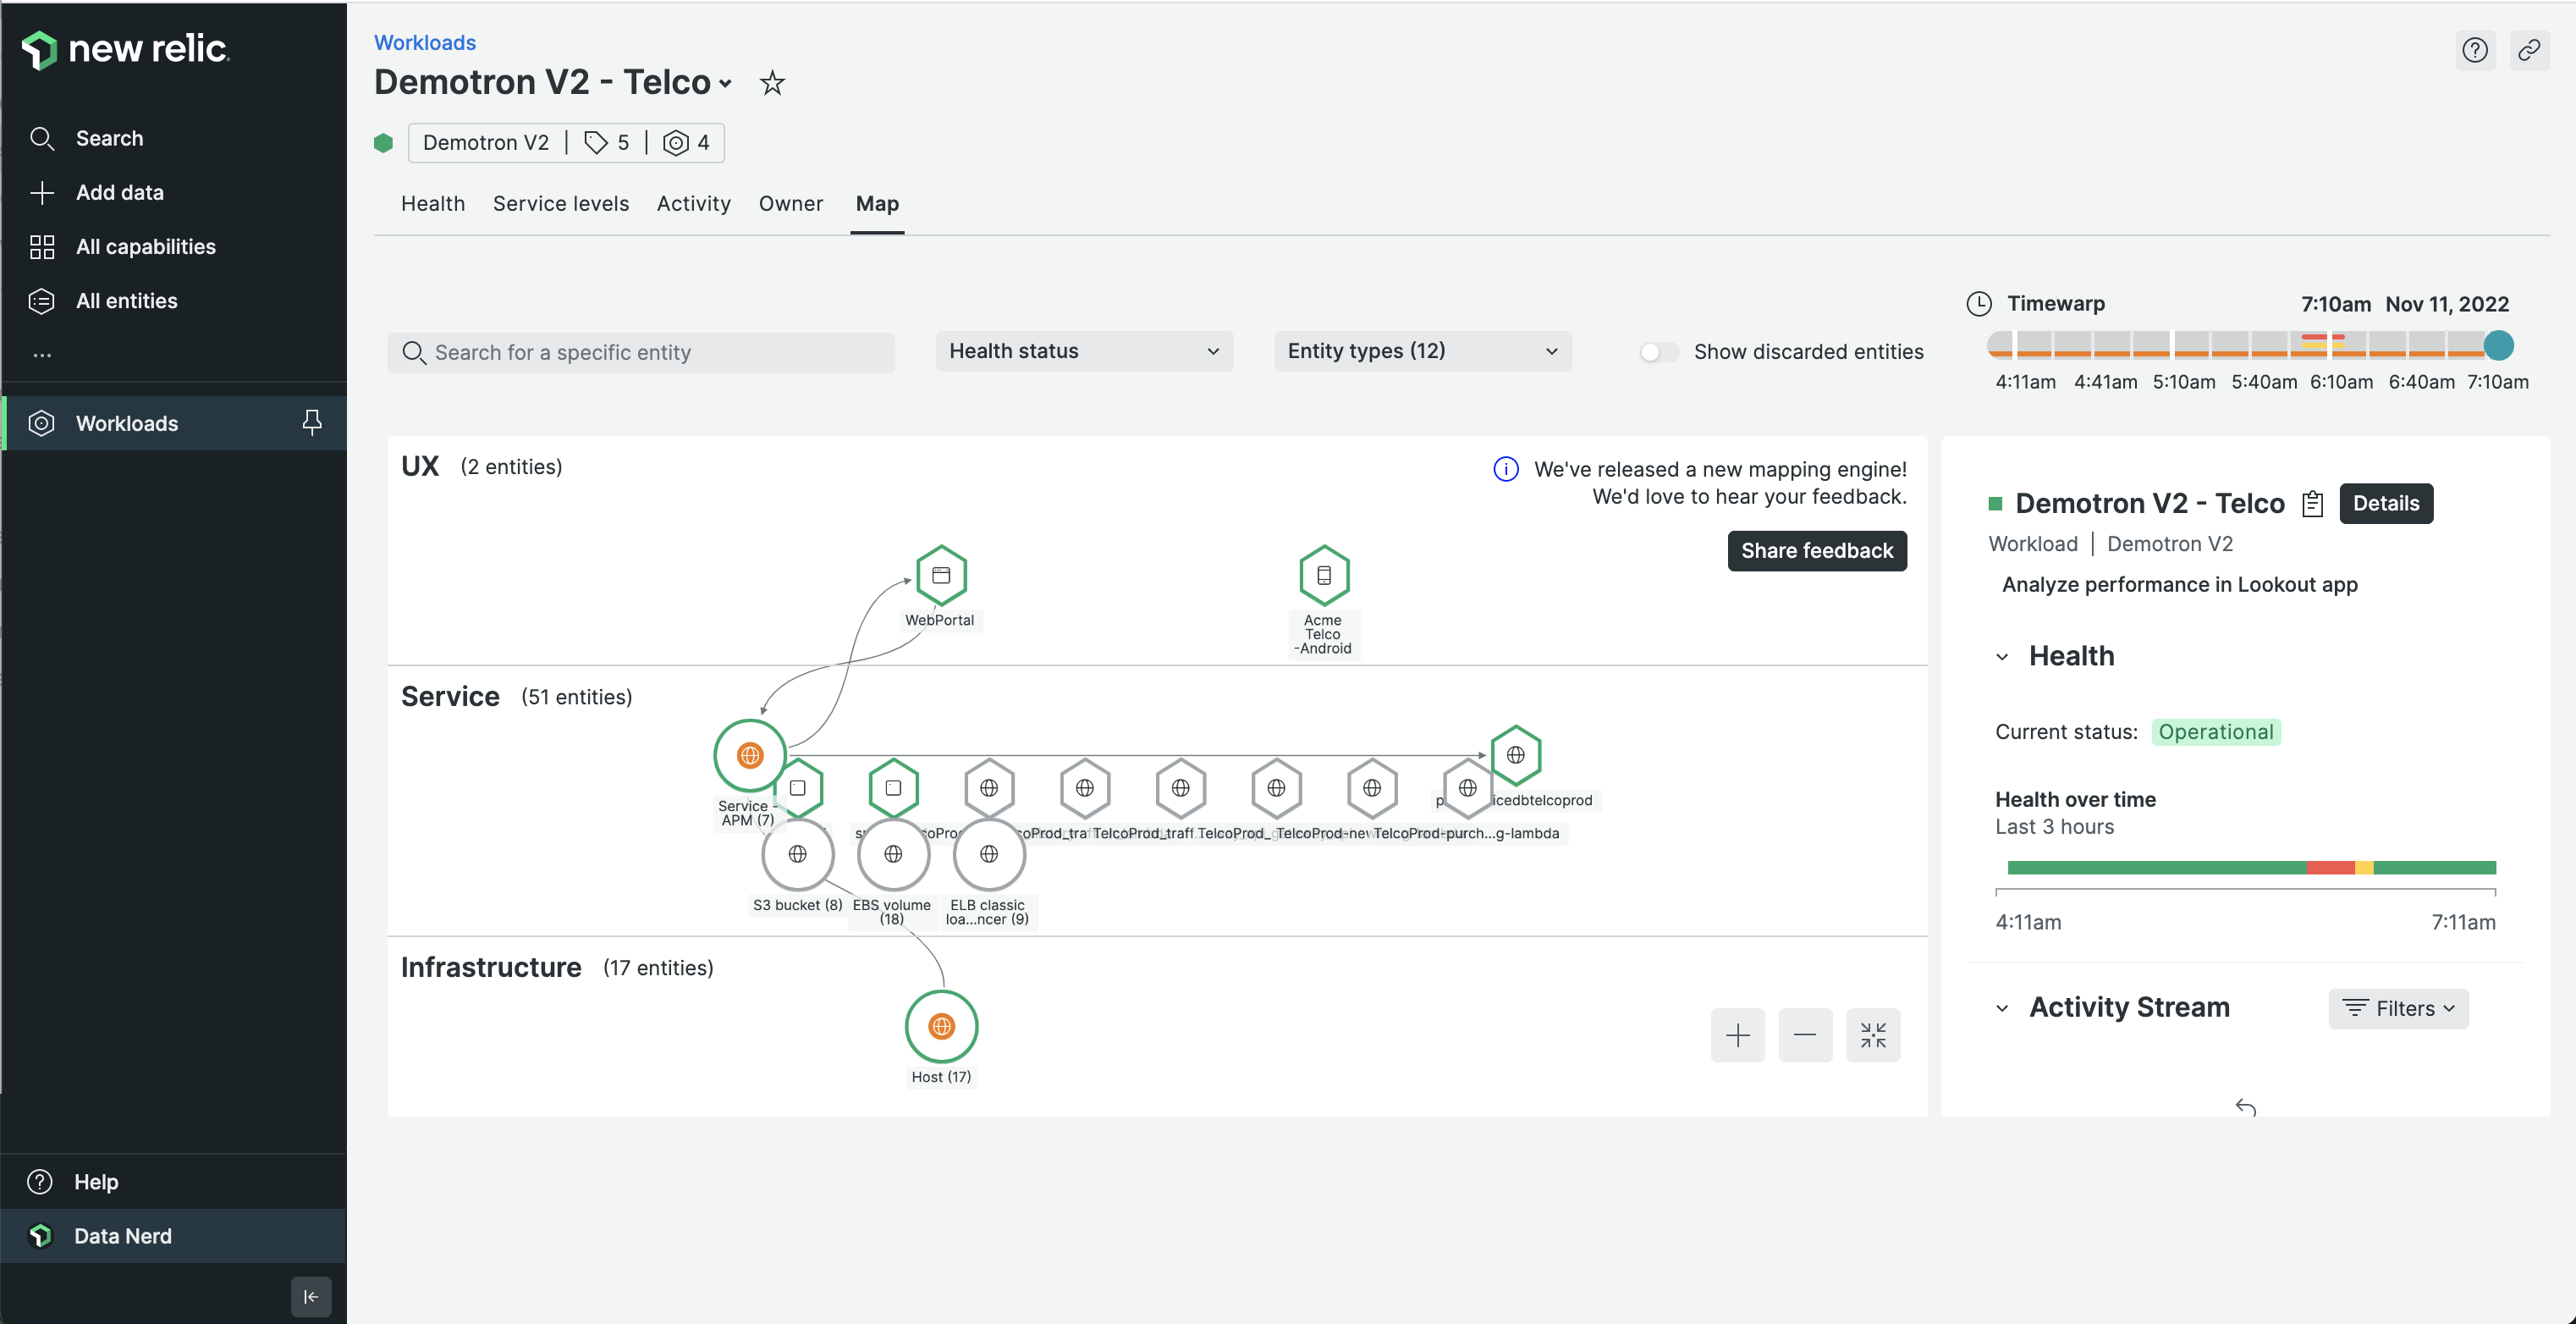
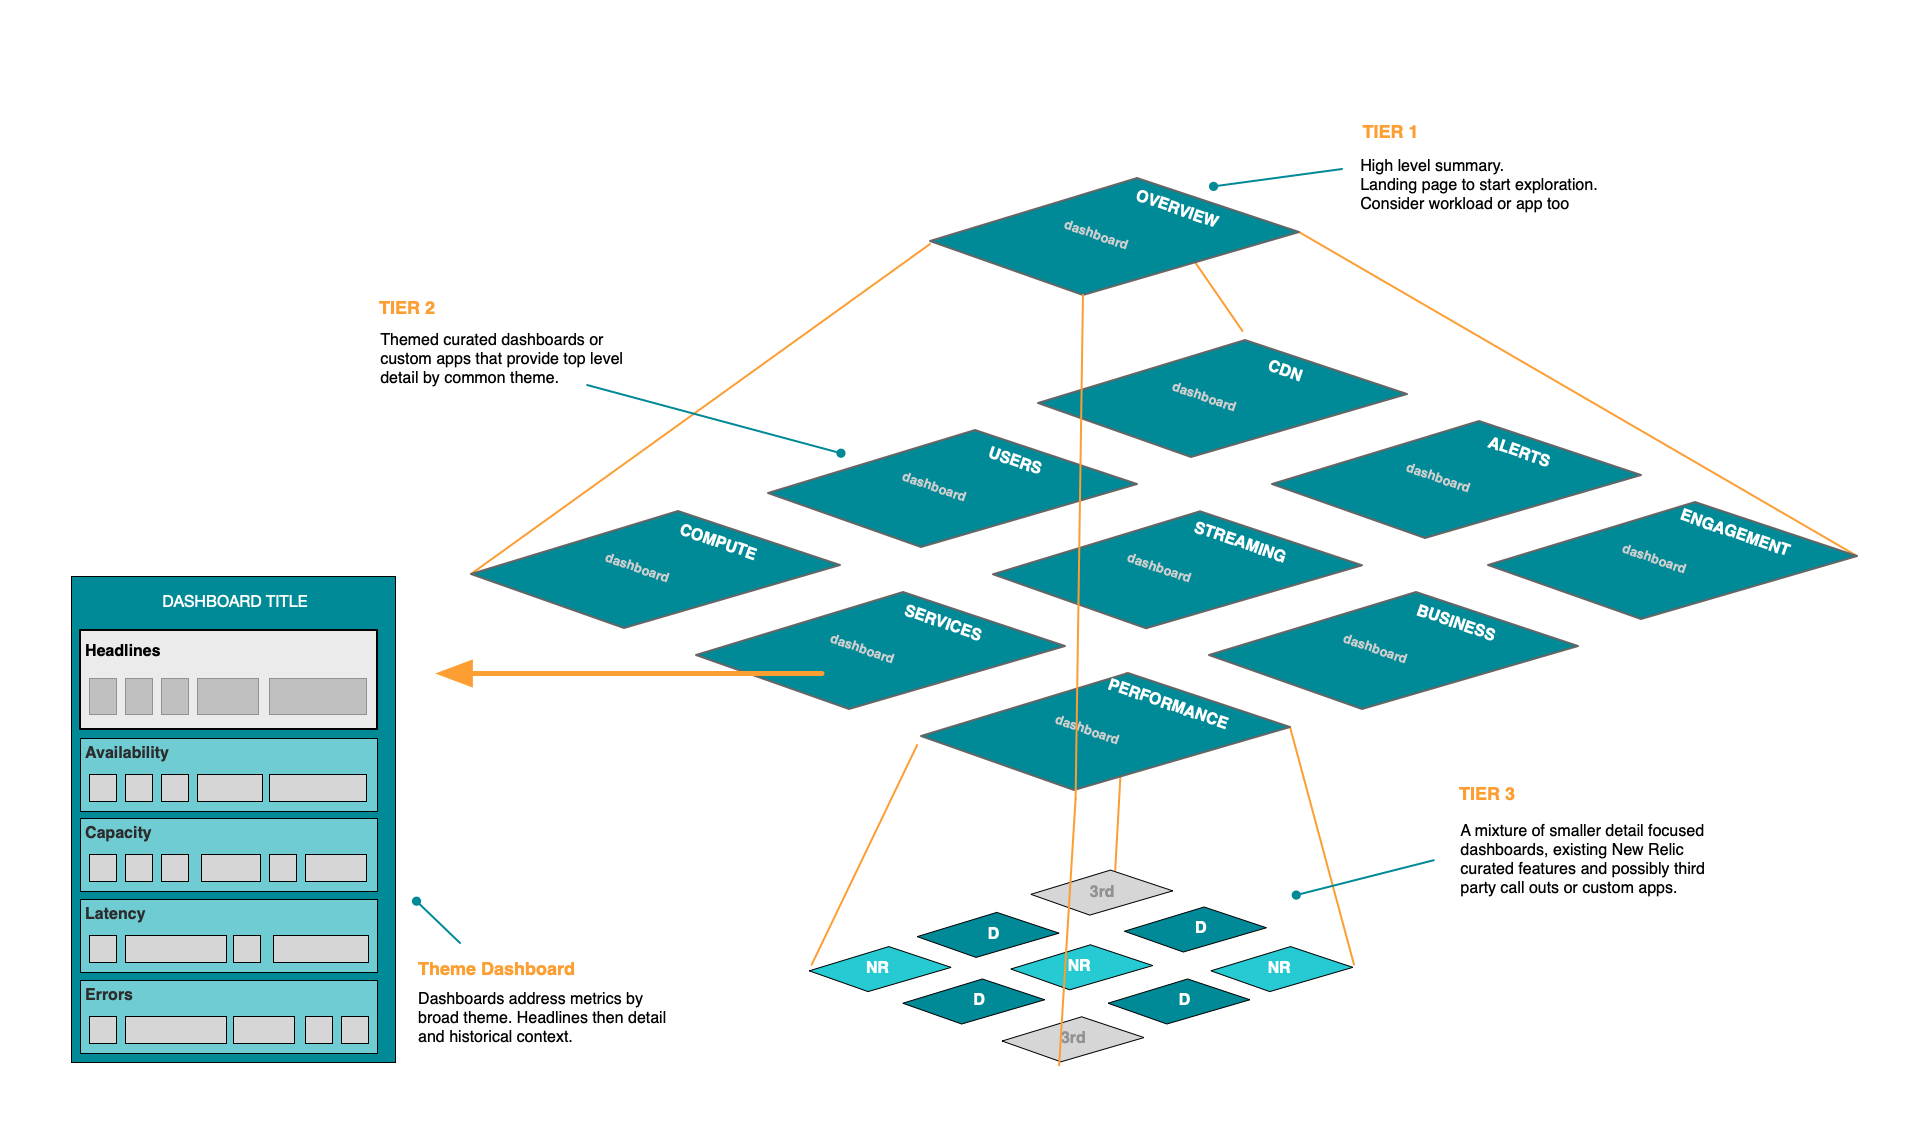
Craft your dashboards carefully and ensure they are consistent in layout and structure across your services so that they are familiar and easy for everyone to use. A pyramid dashboard strategy helps summarize information and allows drilling down for details when necessary. Also, use workloads to help curate operational views of the stack pertinent to the peak event.
These dashboards should be placed prominently in the NOC so that everyone is working from the same single source of truth and can quickly figure out if a leaky funnel is due to a site performance issue, a third-party service outage, or some other cause.
Consider installing the Wall Status Board application. This application is designed to give you an at-a-glance status of your environment and indicate recent historical activity, a great addition to any operations center.
Tip #8: Monitor your golden journey.
Synthetic monitoring is a powerful tool for monitoring availability. For your Black Friday event, ensure that you’re keeping an eye on the really important “golden journeys” or essential actions of your customers, which have key business impacts. Some examples include searching for products, adding items to a basket, checkout, and payment.
Make sure you don’t unnecessarily complicate these customer journeys with features that don’t affect your primary business operations. For example, does it matter if customers can’t rate the product, as long as they can add it to their basket and pay for it? Monitor these ancillary features separately and be sure to categorize your journeys based on business impact.
Tip # 9: Optimize the payment process.
Great news! Your customer clicked the buy button—now your job is done, and it’s time to book the revenue, right? Sadly, no. In fact, you’re just getting started.
Both the payment step and the payment success rate are critical to your success on Black Friday. Even after a customer hits the purchase button, the transaction (along with your revenue) remains susceptible to payment, gateway, payment processor, and buyer errors as well as slow networks and a host of other issues. That’s why it makes sense to track the magnitude and ratio of both successful and failed orders over time to determine trends well in advance of the big days. Similarly, monitoring payment methods can help you identify which ones have the highest success rates—and then you can feature those options most prominently.
Look at it this way: Imagine if you could collect revenue from 100% of your customers’ purchase attempts on Black Friday. How much extra revenue would you book in just that one day?
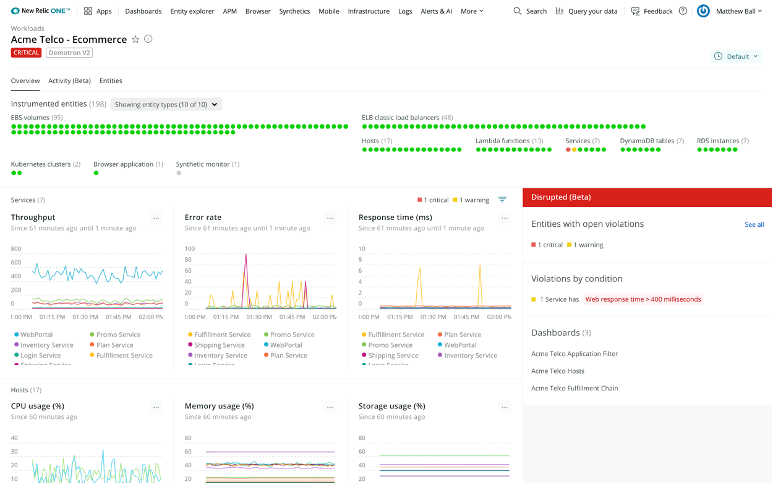
To quickly determine the health of your payment service alongside all of its dependencies, use workloads in New Relic. To assess customer satisfaction and funnel performance, use our browser analyzer and customer journey apps. For deeper insight into the health of applications, websites, and mobile apps, use APM, browser monitoring, and mobile monitoring—all within the New Relic observability platform. These insights help you determine possible reasons why payments failed, making it easier to troubleshoot the issues and quickly improve your payment success rate.
Start by marking your checkout transaction as a key transaction leading up to Black Friday, and set an alert to notify you of any issues. If your payment provider can accept $0 transactions, test the checkout process at regular intervals using synthetic monitoring (see previous tip #8). The goal is to avoid hearing about problems via customer complaints on Twitter. Key metrics to track are payment success rate, payment gateway response time, and third-party payment provider response time.
Next, take a close look at your cart abandonment rate. How much of that is due to app performance problems versus other variables, such as issues with external payment providers or other third-party services? With real-time performance dashboards powered by New Relic, you can answer these questions right away and fix problems quickly.
Tip #10: Stay flexible.
You can test and plan for every scenario you can imagine, but you never know what real shoppers will do when the big day finally arrives. For example, you might expect shopper traffic to thin out around 2 am, but a popular promotion or performance issues with a competitor’s site could cause your site to be flooded with users until 3 am or 4 am, which could cut into the window available to conduct routine housekeeping tasks.
During November and December, you want to continually assess KPIs and traffic trends to identify any opportunity for improvement. If it’s a choice between releasing that shiny new bit of functionality or fixing an underlying infrastructure problem that’s causing a half-second delay in response time, you probably want to save the value-add stuff for a quieter moment.
To be sure, it helps to define priorities ahead of time in the planning phase rather than in the heat of the moment. What you choose to prioritize, of course, depends on your particular situation. Some companies prioritize anything that will capture more profit, whether uptime, conversion rates, or even high-margin products and high-value customers.
Ultimately, the key is to be prepared to cope with rapidly changing plans and priorities to keep things humming in real time when it matters most—to stay agile and resilient instead of locking down your systems so tightly that they become brittle, more likely to break, and more difficult to recover. Keep your skills up with the NRQL Lessons tutorial.
Tip #11: Set yourself up for future success.
Just because you did everything right and enjoyed a successful Black Friday and Cyber Monday doesn’t mean your work is done. You still need to maximize the rest of the holiday shopping season—and take advantage of other big days throughout the year.
To leverage the lessons, hold an evidence-based, blameless postmortem as soon as possible. Instead of relying on opinions and resorting to finger-pointing, use your performance observability data to analyze what worked and what didn’t. Identify innovation and performance improvement goals, refine your processes, measure, and repeat. Then record these outcomes in your Center of Excellence, so everyone can easily find them when this time comes around again.
Remember: E-commerce is a 365-days-a-year business. While there’s even more at stake during peak season, every day is critical for online retailers. Successful companies need a flexible, “always-on” approach to development, testing, and monitoring.
Next steps
Get ready for the holiday season sales blitz by putting these tips into practice using New Relic, and ensure your web properties deliver for your business beyond the holiday season. If you don’t already have a New Relic account, sign up here.
Webiscope is now part of Aman Group
We are happy to announce that Webiscope is now part of Aman Group. We look forward giving our customers and partners greater value with more complete solutions and outstanding service.
This website uses cookies so that we can provide you with the best user experience possible. Cookie information is stored in your browser and performs functions such as recognising you when you return to our website and helping our team to understand which sections of the website you find most interesting and useful.
Strictly Necessary Cookies
Strictly Necessary Cookie should be enabled at all times so that we can save your preferences for cookie settings.
If you disable this cookie, we will not be able to save your preferences. This means that every time you visit this website you will need to enable or disable cookies again.