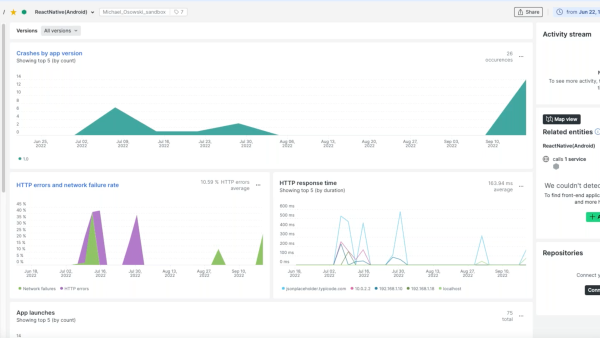
Track user traffic and network latency
Our mobile agent can now easily capture interactions from React Native instrumented apps in the sequence they were created—and then pass performance data to New Relic to track user sessions.
You can seamlessly view your mobile traffic all in one place, and even take a look at which users came from specific iOS or Android phones and tablets. These features and this compatibility with React Native-instrumented apps are crucial for teams struggling to understand their user base, especially in mobile-first countries in Asia or Latin America.
New Relic also tracks network data, including information on HTTP errors and latency, which can also provide insight into regional differences in your customer engagement.
Capture and trace errors
With many mobile applications, the errors recorded are often native to the codebase and can be difficult for non-mobile devs to decipher. Since React Native uses JavaScript to create mobile apps, New Relic can now capture JavaScript errors that are more universally understood by engineers.
Records of console logs, warnings, and errors are all kept in New Relic so you can create retroactive incident reports. Also, distributed tracing for React Native helps drill into the backend cause of an issue on the frontend.
Ultimately, adding this value to our mobile monitoring is part of our mission to enhance performance observability and streamline the development lifecycle for frontend engineers.
More features to monitor all your mobile applications
Beyond our latest support for React Native and upcoming support for Flutter, our powerful platform is designed to solve all your mobile monitoring needs, from frontend to backend.
Crash analysis
Our mobile monitoring solution tracks both native iOS and Android crashes, as well as crashes due to React, all in one place. Intelligent crash analysis uses machine learning to provide insights into anomalous crashes, which gives the user a full profile of crash data, scoped by OS and device type.
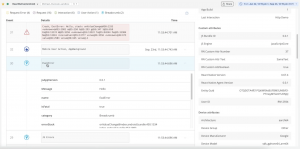
Event trail
Our event trail shows exactly what actions mobile users took on each screen, with granular timestamps, that led to each error occurring.
Select a user event to see an in-depth stack trace of the requests that were called and which services triggered the error. This significantly reduces the mean time to detection of errors for internal users. The Event Attributes tab to the right also shows the device, OS information, geographic region, and more for each user that experienced an issue.
Distributed tracing
Our distributed tracing tab takes HTTP requests to a new level. In addition to viewing HTTP response trends for the organization’s React Native-instrumented applications, you can see traces that detail why the HTTP requests didn’t perform.
For example, for each request, you can see the number of entities it connects to and how they interact with one another. Essentially, you have full visibility of the upstream and downstream effects of an HTTP error. You can see in real time how the performance of your services affects your application, as well as view details on all in-process spans. This helps businesses tremendously by eliminating internal finger-pointing in determining the cause of an issue. Now, engineers know exactly where and when the crash occurred and can focus on resolving the problem.
User interactions
New Relic also tracks top user interactions based on the number of views or time spent on a particular part of the application. You can further analyze user interactions in a custom New Relic dashboard, where you can see exactly what is happening inside the environment—even down to the millisecond timestamp that your users visited your page. These dashboards are crucial for higher-level executives in an organization to keep an eye on application performance at a glance.
The power of mobile monitoring for React Native
As a platform, New Relic is extremely powerful. You can track your React Native-instrumented iOS and Android applications from frontend to backend, and even set alerts to receive notifications when crash or error rates exceed a certain threshold.
We champion modern mobile development and want to empower you with the right tools to keep up in today’s fast-paced environment. With these additions to the New Relic toolkit, deploying and monitoring cross-platform applications has never been easier.