Create and Manage Maintenance Windows Through PagerDuty Mobile App
On-call teams need a better solution that is more intuitive and flexible–one that allows them to disable a service as well as pause incident alerts on their mobile device, so they can focus on what matters: solving an incident without interruptions.
We believe effective incident management empowers teams to do their jobs more efficiently while minimizing interruptions. That’s why we are excited to announce the general availability of Maintenance Widows through the PagerDuty Mobile App. Maintenance Windows help responders temporarily disable a service, including all of its integrations, while it is in maintenance mode. When a service is in the maintenance window, all of the service’s integrations are effectively “switched off” so that no new incidents will trigger.
Easy to create, update and delete maintenance windows from anywhere:
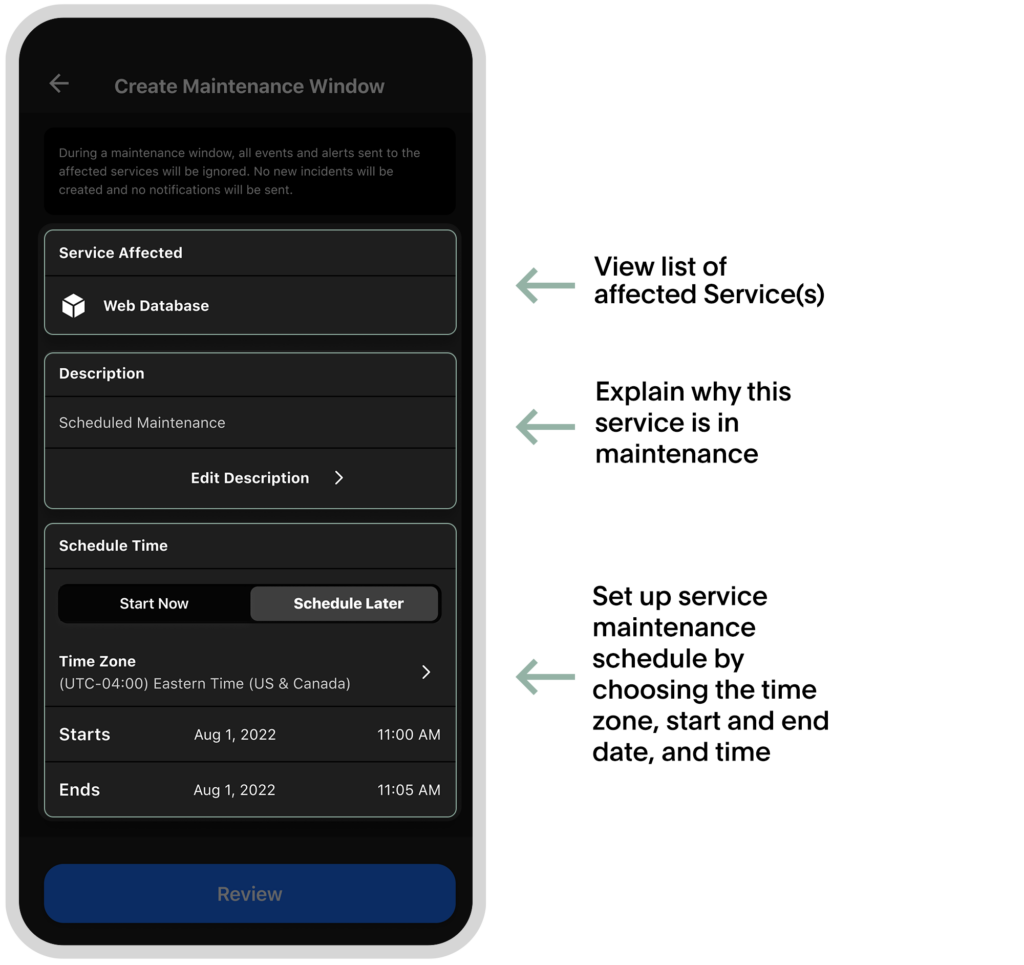
Creating Maintenance Windows within the mobile app takes just a few simple steps:
Choose the Service Directory from the hamburger menu and select your preferred service.
Tap on settings and tap “create maintenance menu.”
Enter a description to explain why this maintenance is happening.
Schedule the beginning and end date (and time) for the maintenance.
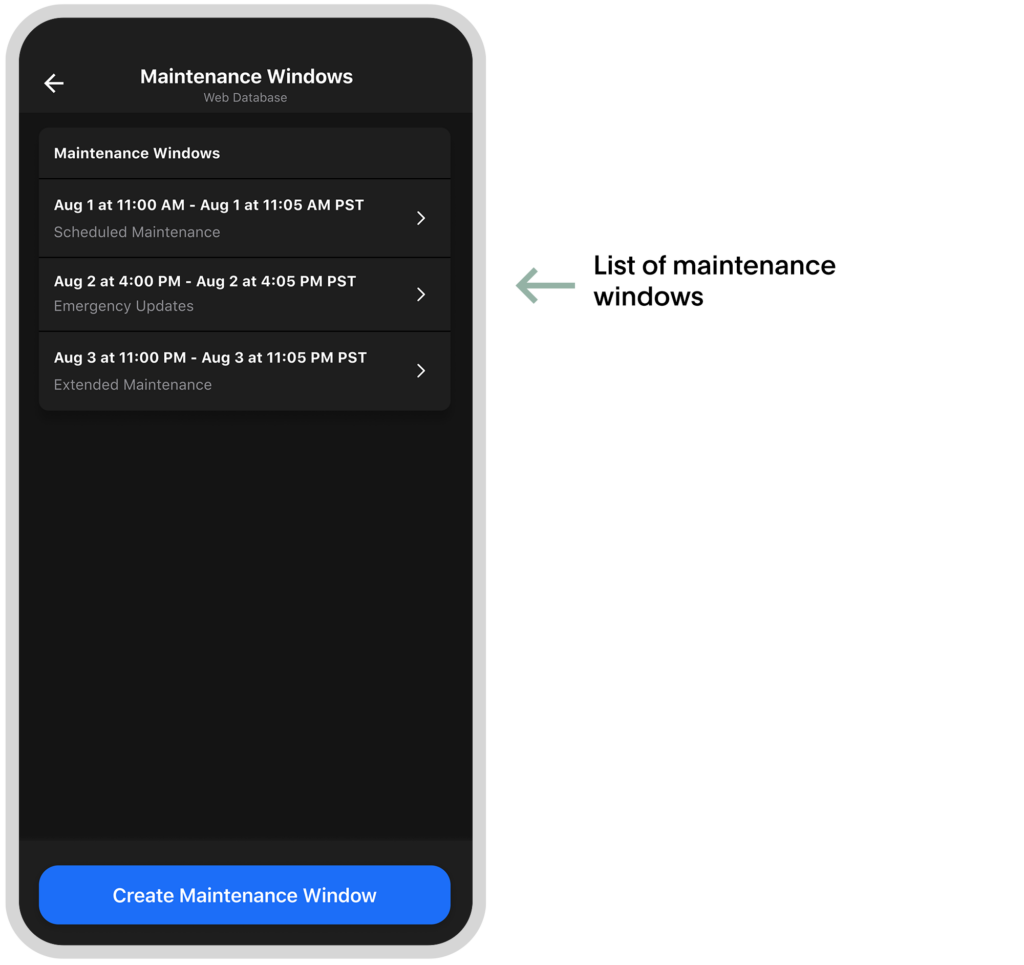
Once the maintenance window expires, the service exits the maintenance mode, and new incidents can be triggered again.
You can delete an existing maintenance window by going to settings and tapping on “end maintenance window.”
A maintenance window for multiple services:
PagerDuty’s mobile experience allows for the creation of a maintenance window on one service at a time. Users who want to create a maintenance window covering multiple services can be done through the web application.
Updating and deleting options for a maintenance window covering multiple services can be done through the mobile app.
This latest addition to PagerDuty Mobile empowers on-call teams to manage and respond to incidents without sacrificing time and work-life balance. We’re continuing to improve the PagerDuty mobile experience by giving teams the trusted information to continue serving their customers better.
You can learn more about PagerDuty Mobile and the Maintenance Windows through our Knowledge Base Articles. Or try it out using the following QR code to download:
Want to learn more about PagerDuty Incident Response and how it works with our mobile app? Participate in the free 14-day trial and experience how PagerDuty can empower your teams with faster time and efficiency, and drive innovation across your Operations Cloud.
3 steps to improve digital customer experience
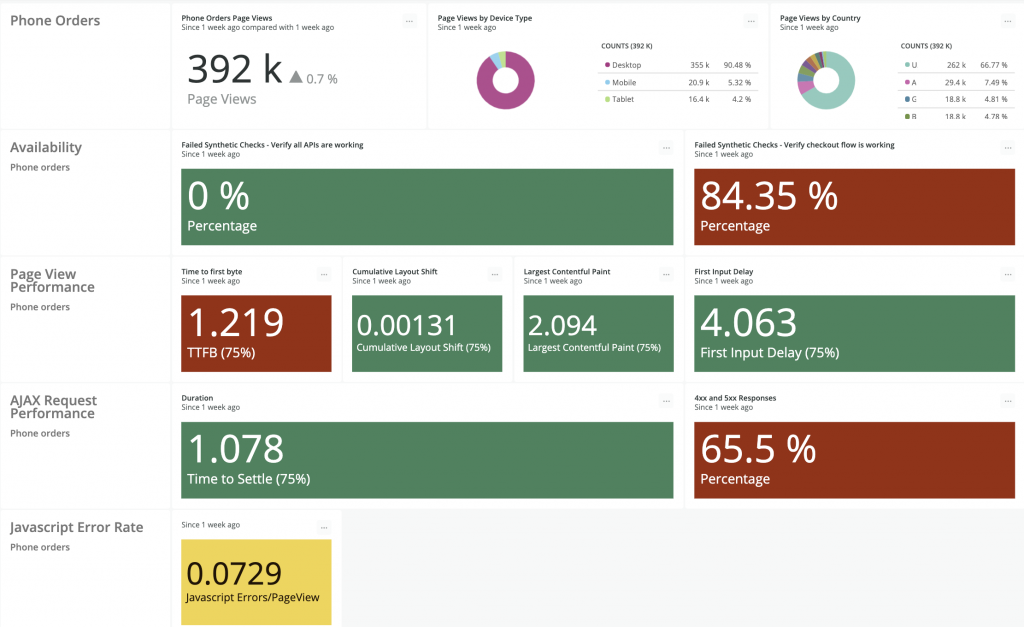
1. Measure the right things
Make sure you’re measuring the right key performance indicators (KPIs) to understand your customers’ experience. Consider measuring and tracking the following indicators of service performance:
Availability
Largest contentful paint (LCP)
First input delay (FID)
Cumulative layout shift (CLS)
Time to first byte (TTFB)
AJAX response times
HTTP error rate
JavaScript error rate
This set of KPIs forms your quality foundation for customer experience observability. These metrics will show where you need to optimize your site for satisfaction, retention, and conversion rates.
Once you have the right KPIs to measure customer experience, organize the data to make metrics understandable and actionable. Do this by breaking the data into different segments based on your business. Ways to segment customer experience data include location, device type, product, line of business, environment, and teams.
Get started: Read our guidance on how to segment your data to help you better understand customer experience and identify areas for improvement.
3. Start identifying where you need to optimize
Start by thinking about the future state you want to achieve by improving customer retention, conversion, and satisfaction. For example, if you discover that most customers in Europe experience a two-second or longer first input delay, but users in other geographies experience four seconds, you’ll need to drill down into why this is happening.
Get started: Follow the instructions in the quality foundation guide for finding and resolving errors. Review your goals and thresholds for customer experience KPIs. Compare these to your current state—for example, JavaScript error rate should be less than 5% per page view.
How Veygo uses serverless to improve customer experience
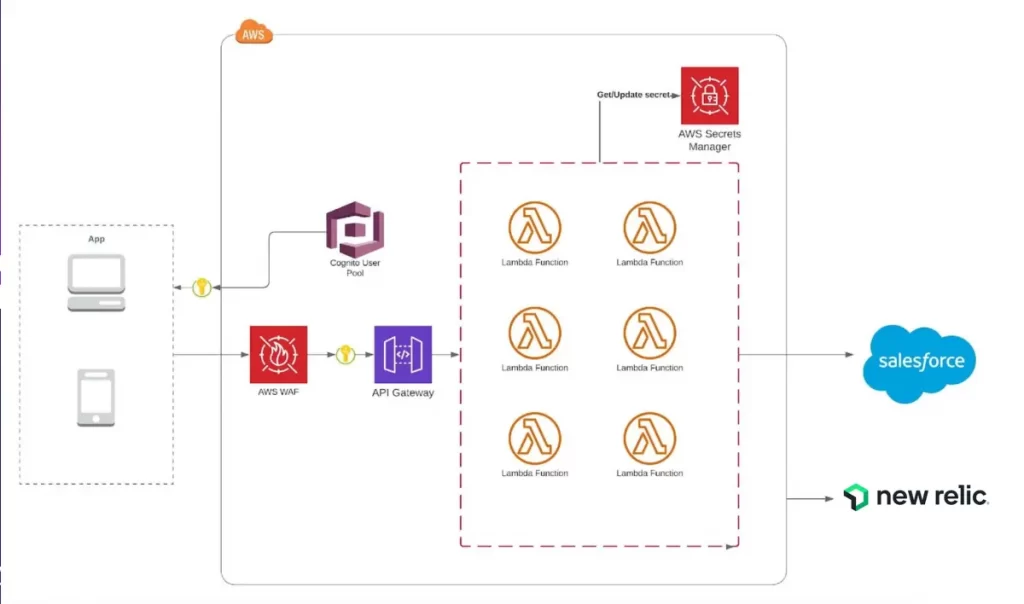
We wanted to integrate Salesforce customer data from our mobile and web applications across all of our operations. This is why we chose serverless. For example, if a customer purchases a policy, an event fires an AWS Lambda to send data to Salesforce to perform administrative tasks, like attaching a policy to the customer’s account. Then, our customer agents can then see this in a customer call in real time. This information can include policy purchase date, update, or cancellation, and much more. Our agents don’t need to solicit any of this information from the customer.
On the technical side, the customer application programming Interfaces (APIs) are available through the AWS API Gateway. We used the Serverless Framework to configure and deploy our architecture. In the serverless config file, we described endpoints and when to call AWS Lambdas. That also made it pretty easy to integrate with AWS WAF for security, AWS X-Ray for tracing, and AWS Lambdas to create the serverless functions.
Monitoring serverless with dashboards
In serverless environments, you’re a step removed from the infrastructure. But you still need to see what is happening in your tech stack and how it affects your customers. We built dashboards to encourage a lean, agile culture. These dashboards focus on a small set of core metrics to help us understand customer experience and let our software engineering team drill down into issues as they arise. We also have retros every week where we discuss opportunities for continuous improvement. It’s a team approach. We share what worked to resolve challenges and we all learn from them. We discuss our infrastructure together and celebrate our progress as we climb towards our delivery goals.
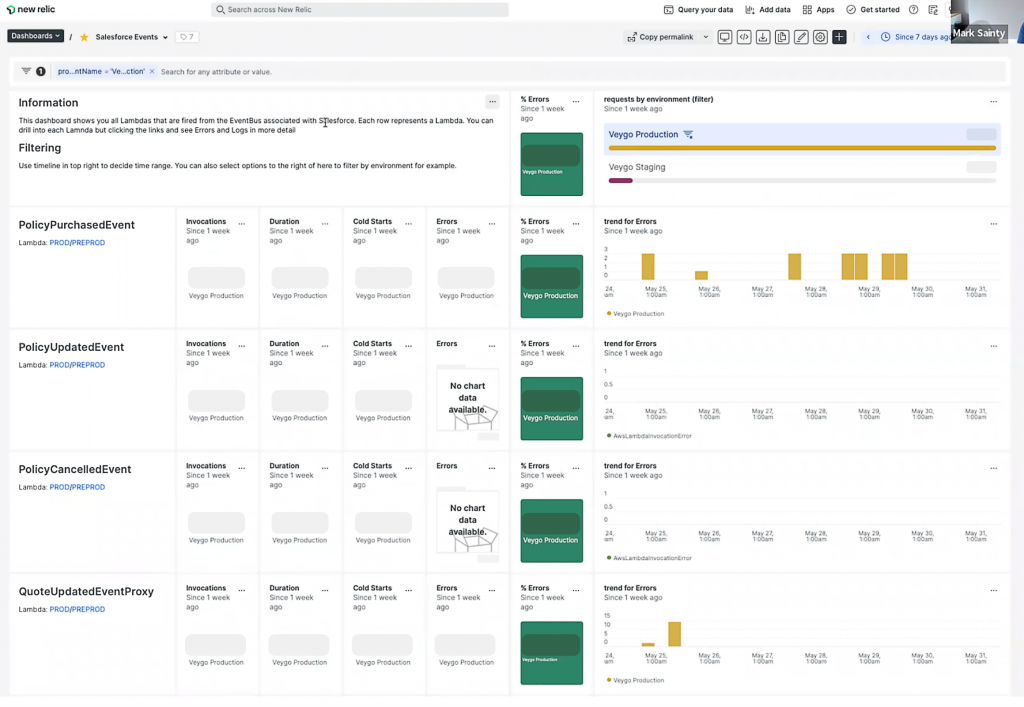
To observe our serverless Lambdas, alongside metrics on our API gateway to monitor 500 errors, we use the New Relic Lambda function monitoring plugin. We built dashboards that show Lambdas and API calls in one place, alongside rejected requests. With the plugin, our engineers receive alerts in Slack and then reference the dashboard to drill down into specific Lambdas.
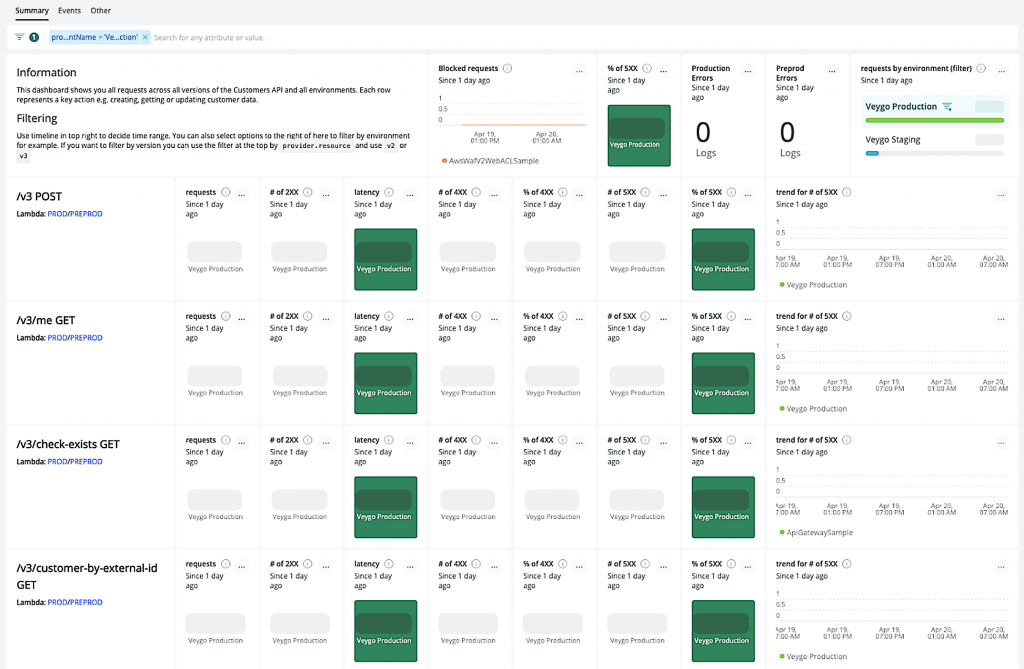
In our customer API dashboard, we display API endpoints, number of requests, and number of errors. If an alert is generated, you can see where the problem is. We’ve also got quick links on the dashboard that take you to the Lambda for a particular API endpoint. That also has the AWS Lambda metrics in New Relic that you can drill into. You’ve got logs as well. This is generally all you need to pinpoint any issues around your serverless APIs.
4 key metrics
Throughput
Measure: Deployment frequency
At the moment, we’re at about 140 releases a month, and we want to get to 200. All of our work is broken down into small tickets that we can advance through quickly. It’s a great way to work and it’s motivational to complete smaller tasks rather than one large task that can loom over the team. Completing these smaller tickets means the tickets get put into production sooner, and the team feels like we’re constantly delivering things.
We use a dashboard to keep us accountable. It shows the number of releases per day, week, and month. We also track the releases per app and how these releases trend. These dashboards are a pillar in our discussions on moving to 200 releases per month.
Measure: Lead time for change
Our lead time for change is from 10 minutes to 1 hour, depending on the application. We want to measure this to ensure any code committed will make it to production without delays. Improving the lead time has a positive impact on deployment frequency as engineers are not waiting too long before moving on to their next piece of work. It also has a positive impact on mean time to recovery (MTTR) as any change to fix an issue will also get to production quickly.
Stability
Measure: Change failure rate
With a high number of releases, an efficient delivery pipeline is a challenge. If you’re breaking everything down into smaller tasks, but your release takes two days to deploy—you’re not efficient.
Our main branch is in Git, which performs steps to push it to production. It’s running all your tests for you—doing all your checks, running integration tests, UI tests, and then deploying to production. This is where it is essential to have a quality metric. You need to make sure that your efficiency score isn’t sacrificing CI/CD pipeline agility by pushing through broken code that ends up stalling releases.
We are currently working on identifying the ideal quality metric internally. For now, we think this could be based on the amount of failed releases. For example, you might do 100 releases and you have to roll back two. You need both efficiency and quality metrics. If you just focus on the number of releases, you could release bad things all the time, with lots of failures. It’s important to have a balance between the two metrics.
Measure: MTTR
MTTR should be within an hour. We want to measure that and hold ourselves accountable to it. Visibility into recovery times helps the business decide if we want to pay for an additional supplier, which is an additional cost. The goal is to monitor MTTR so that we can make decisions that help us build resilient infrastructure.
How to Standardize Service Ownership at Scale for Improved Incident Response
Why is service ownership important?
Imagine this scenario: you’re called into a meeting because something is wrong somewhere in the system, but since you don’t have service owners determined, nobody knows who the SME is. Fifteen minutes turns to 20, and then 30, and so on. Meanwhile, more people are jumping on the call, yet making no progress.
This type of chaotic incident response wastes precious time – it’s the epitome of inefficiency. And the worst part is that it still happens all the time.
It doesn’t have to be this way. But first, let’s examine why so many teams are burdened by manual incident response that drags out forever. When you look at the reasons for the slow down, it boils down to teams not being able to answer a few very important questions:
What services are impacted?
Who owns those services?
What are these services’ dependencies – and who owns those services?
Meetings like the example above attempt to answer these questions, but in a reactive manner. Until teams can answer these questions, they are at a stand still and cannot make progress on resolving the incident.
This is becoming more and more common as the technology ecosystem continues to change and grow more complex at companies of all sizes. Hundreds of services, microservices, and distributed ownership make it hard to know how to take action when something goes wrong.
Service ownership can help organizations become more proactive about incident response. Nevertheless, this is no walk in the park. Cultural change is hard, and even the most successful organizations which have managed the shift to DevOps and service ownership would agree that following best practices, and having a process for adopting service ownership, can help with stickiness and drive scale across the entire organization.
When organizations are able to adopt service ownership, everyone—from service owners, to executive stakeholders, to customers—benefits. Service owners are only called in when necessary. Stakeholders know what’s affected by an incident, and can work with the technical team to mitigate impact. And customers will encounter a shorter service disruption with clearer communication throughout.
In a world where customer expectations have never been higher, and customer experience is key, this can put your organization above the competition – all while making life better for the people who respond to the incident.
But what actually is a service?
Defining a service can be trickier than it may seem at first glance. We’ve seen organizations split services many ways, and it’s not always as simple as matching services to what’s deployed in the cloud. For some organizations, there’s a monolith that needs to be taken into account as well. So how can you determine how to break things up into manageable pieces for which a team can be responsible?
At PagerDuty, we define a service as “a discrete piece of functionality that provides value and that is wholly owned by a team.” Another way to think of it is that a service represents an entity you monitor, and serves as a container for related incidents that associates the incidents with the right escalation policies.
In short, it breaks down like this: if you monitor it, and you want incidents to be associated with it, and you want certain people to be on call for it, then it’s a service. This is a broader definition that allows more flexibility in how teams might define unconventional services.
However, responders need to know more than just these boundaries to be fully prepared to deal with issues. This is where service configuration can make a big difference.
What makes a service well-configured?
At PagerDuty, we’ve established a set of standards that we feel are valuable to organizations looking to further their service ownership journey. These act as guidelines for how we create our services, and determine what “good” looks like.
They’re flexible as well. Not every service is built the same, and some of our standards may not apply in each circumstance. Think of them as a jumping off point that our customers can use to make on-call be more efficient and less painful to their first-line responders.
It’s important to note that each organization will ramp differently, and that service ownership is a process, not a single box to be checked off a to-do list. Depending on your operational maturity, you may need to set and adopt standards at a different pace.
If you’re relatively small and new to service ownership, with only a handful of mostly cloud-based services, you may be able to set standards and configure your services accordingly in a few days. If you’re starting from scratch, it’s even easier: you can apply these standards when you create your very first services, setting you up for long-term success without needing to go back and make changes to previously configured services.
But if you’re a larger organization with hundreds or even thousands of services, this might be a tougher shift. For these organizations, here’s a few questions to ask that can help you think about how to move forward:
What subsets of existing services could you set standards for today, and what are those standards? You may find that some standards are easy to apply to all your services. For example, services should have a name that accurately describes what it does. If there are standards like this that you know the majority of services should follow, then that’s a good place to start implementing. Think about how you could ask pilot teams to make these changes.
What does the process for creating net new services look like? You may have your standards determined, but changing all your current services to meet these standards is a difficult undertaking. If you’re a larger organization, it’s not usually feasible to reconfigure all services at once – and reconfiguring services can be more frustrating than following a process to set them up correctly in the first place.
What is your long-term goal, and what does a timeline look like for that? Some services may not need these standards, and that’s okay. Make a plan for the rest of the services with a deadline, then start onboarding additional teams to the process, making small, incremental changes over time.
How do we know our dependencies? Beyond creating and applying standards, it’s also important to know how your services map to each other and affect one another. While establishing standards, think about how you can encourage codifying this information during the configuration process.
Individually, answering these questions may not seem like big differentiators – but when you think about how they scale, they make a big difference for how well you respond to incidents.
How does this help incident response?
During incident response, it’s important that you don’t waste time or energy on work that doesn’t matter. Everything must be pared down to what the team needs to focus on to resolve the incident.
Service ownership helps you gain that clarity throughout the response process:
For instance, if you’ve configured your service well, you’ll be alerted with the correct urgency and minimal alert noise, allowing you to respond to only the most important signals and prioritize accordingly. You’ll also be able to get the right people on the scene quickly, since you’ll know who the service owners are. As you grow in maturity, you’ll also be able to create automation sequences for your services that help you reduce the work required to return service to normal.
Diagnosing what went wrong is also easier, as you’ll see what changed on the service. And with service mapping, you can understand the overall impact to the system.
During resolution, you can work faster with the integrations that your service needs, as well as keep stakeholders informed. You can streamline communication to only those people who you know will be affected by your incident, keeping the impact to a minimum even within the organization.
Lastly, you’ll learn from incidents better. As the SMEs for your service, you’ll gain historical context, and feed those learnings back into your response process, making you more resilient over time.
As you scale service ownership across the organization, these improvements make a drastic difference to both customers and teammates. If you’re looking to adopt service ownership or improve your operational maturity, and want a partner that can guide you through the process, try PagerDuty for free for 14 days.
Webiscope is now part of Aman Group
We are happy to announce that Webiscope is now part of Aman Group. We look forward giving our customers and partners greater value with more complete solutions and outstanding service.
This website uses cookies so that we can provide you with the best user experience possible. Cookie information is stored in your browser and performs functions such as recognising you when you return to our website and helping our team to understand which sections of the website you find most interesting and useful.
Strictly Necessary Cookies
Strictly Necessary Cookie should be enabled at all times so that we can save your preferences for cookie settings.
If you disable this cookie, we will not be able to save your preferences. This means that every time you visit this website you will need to enable or disable cookies again.

 You can delete an existing maintenance window by going to settings and tapping on “end maintenance window.”
 A maintenance window for multiple services: