Code-level metrics
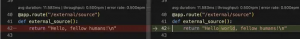
The New Relic CodeStream IDE extension brings software performance into the daily practice of developers by providing a pervasive, always-on view of code-level metrics. The three golden metrics that are applicable to application services are displayed as a line of text, called a CodeLens, above each method in your code, automatically instrumented by the New Relic APM agent.
In this example, you can see the golden signals of response time, throughput, and error rate:
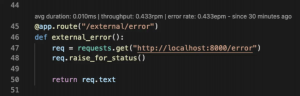
Select a CodeLens for a set of charts visualizing each of the metrics. You can also get more insight by clicking through to the APM service summary page in New Relic.
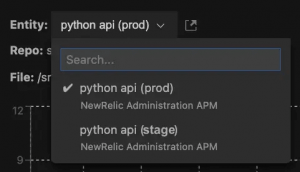
More importantly, you can also change the service for the code-level metrics that you see. This allows you to see how your code is performing in other environments, such as staging or QA, so you can take a more proactive approach to performance problems. You can get ahead of these issues before they hit production.
Data-driven code reviews
Code-level metrics are also shown inside your IDE diffs for both pull requests and feedback requests.
Imagine how this data could inform your code review process. The CodeLenses let you know how the production version of this code is performing. If there are performance issues, you can make sure that they’re addressed as part of the pull request. If not, send it back!
If the code is already changing, there’s no better time to address outstanding performance issues.
Service-level telemetry
While seeing how the actual code is performing is arguably the most important thing for your day-to-day work, it’s also important to see the bigger picture. You might think about these questions:
The code I’m responsible for builds a particular service. How is that service performing?
How are the services that are related to mine performing?
Unless there’s an incident, developers rarely see this view of the world.
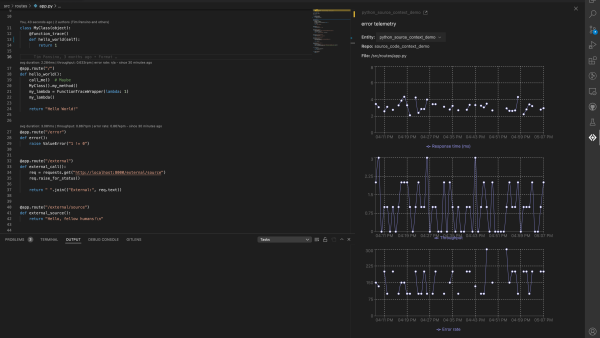
The observability section of CodeStream changes this old approach. The golden metrics for the services associated with the repo you have open in your IDE are available at a glance. And with just one click, you can see the metrics for any service that calls, or is called by, your service.
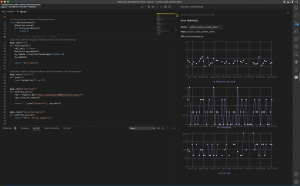
In this screenshot, you can see an example of the response time, the throughput, and the error rate for a service, the services that it calls, and the services it is called by:
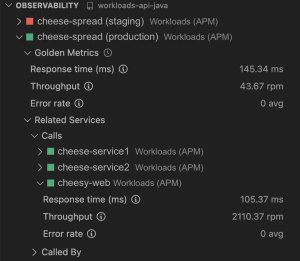
With service-level telemetry, you get the big picture, right in your IDE.
CodeStream video walkthrough
For a quick walkthrough of these features, check out this video:
Getting started with code-level metrics is easy
Follow these instructions to get started. Note that code-level metrics are currently supported for Python, Ruby, .NET, and Go. Java support is in private preview. PHP and Node.js support are on the way!
1. Update your APM agent
Update your APM agent to the version that supports code-level metrics.
-
- .NET Version 10.2.0 or later
- Python Version 7.10.0.175 or later
- Ruby Version 8.10.0 or later
- Go Version 3.19.2 or later
For .NET and Go you’ll also need to enable code-level metrics in the agent configuration.
2. Install the CodeStream extension
Install the CodeStream extension as you would any other extension for VS Code or a JetBrains IDE by going to the marketplace in your IDE. Make sure you’re running the latest version (Version 14.2 or later).
3. Sign up for CodeStream
After installing the extension, you’ll be prompted to create a CodeStream account, even if you’re already a New Relic user.
CodeStream offers several signup options, but we suggest that you select Sign up with New Relic. In one step, you’ll be signed up for CodeStream and connected to your New Relic account. You’ll be prompted to enter your New Relic User API Key.
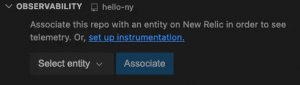
4. Associate a repository with your APM service
Open a repository in your IDE that corresponds to an APM service where you’d like to see code-level metrics. If the repository isn’t already associated with the APM service, you’ll get a message in the Observability section of CodeStream prompting you to make this association.
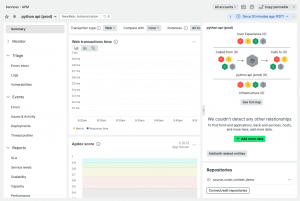
If you have multiple services that correspond to this repo (such as different services for different environments), you can make additional repo<>service associations on the Summary page for your APM service in New Relic. Go to the Repositories section in the bottom right.
5. Open a file and look for each CodeLens
Open a source file from your repository and look for the golden metrics in a CodeLens above each instrumented method.